The precious metals sector continues to be a “grind”, offering a few trades but mostly sideways to lower action.
Gold prices have slogged along and this had held the Gold Miners (NYSEARCA:GDX) back… until recently.
The Gold Miners (GDX) and broader Mining Index (XAU) came to life in September and October.
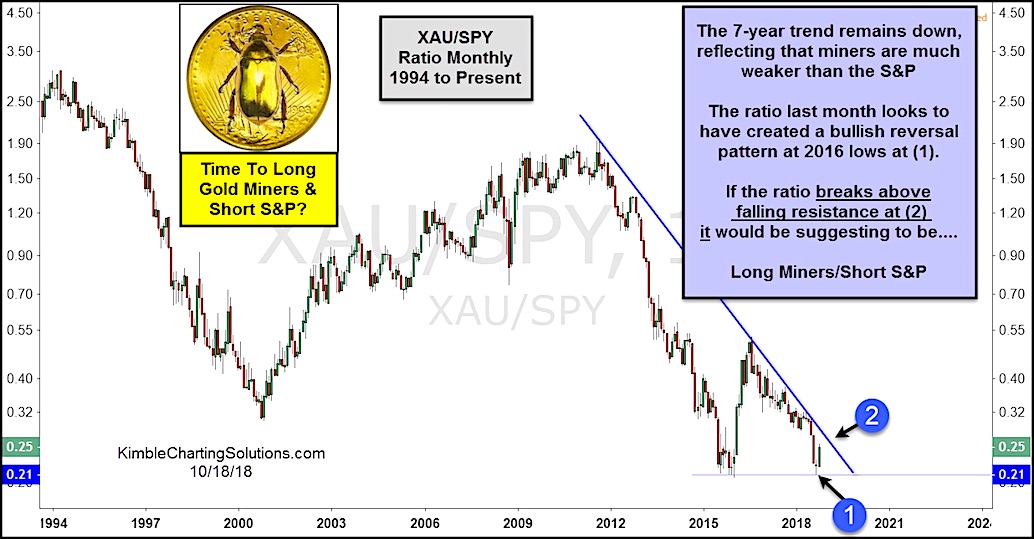
The miners are in a multi-year down trend, however there is a potential bullish setup in place. See the chart below where we highlight the ratio of the Mining Index (XAU) to the S&P 500 (SPY).
The ratio, which Gold Bugs want to see rising, looks to have created a bullish reversal last month at the 2016 lows at point (1).
And October is seeing a follow through move to the upside.
If the ratio breaks out above falling resistance at (2), it would be suggesting a long miners / short S&P 500 trade.
Mining Index (XAU) / S&P 500 (SPY) Ratio Chart
Note that KimbleCharting is offering a 2 week Free trial to See It Market readers. Just send me an email to services@kimblechartingsolutions.com for details to get set up.
Twitter: @KimbleCharting
Any opinions expressed herein are solely those of the author, and do not in any way represent the views or opinions of any other person or entity.


