Critics love to list out all the reasons not to buy Gold (NYSEARCA: GLD).
It’s purely speculative. It doesn’t generate any income. It’s a precious metal, but it’s still just metal.
But here’s the thing about Gold. There is a limited supply in the world. Humans have always been fascinated by gold and have always been willing to pay a premium for it.
Most importantly, it tends to be uncorrelated to stocks.
At a time of uncertainty, when one headline can generate unprecedented volatility, something like gold could be a compelling option as a safe haven.
So what are the charts saying about the Gold ETF (GLD) right now?
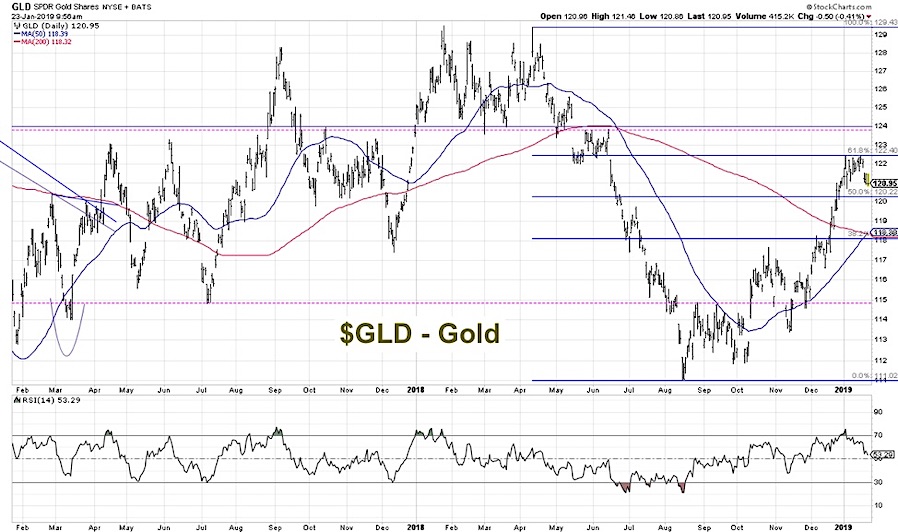
Gold (GLD) formed a double top in early 2016 just above $129. GLD then tumbled through the summer, losing over 14% of its value through the August low. From that bottom of about $111, the GLD has now recovered back to around $122.
So far in 2019, the GLD has bumped up against Fibonacci resistance, having retraced 61.8% of the 2018 selloff.
Dow Theory tells us that an uptrend is a series of higher highs and higher lows. There is no denying that Gold has been in a relatively consistent uptrend by that definition. This bullish move pushed the GLD above its 50-day and 200-day moving averages.
Given the trend measures I described above, I would consider Gold to be in a confirmed uptrend until you see a lower high and lower low.
If and when gold corrects, the RSI may be a good gauge of whether it’s a buyable pullback or a signal of further downside.
In bullish market phases, the RSI tends to remain above 40. Look to the pullbacks in September and November 2018 to see how the RSI tends to find support around the key 40 level.
When the RSI starts to break below 40, that can be an early warning of a new bearish phase. Once that level is broken, look to where the RSI rises during the next price bounce. In a bearish phase, the RSI tends to remain below 60.
In early 2018, the GLD pulled back a number of times, yet each selloff saw the RSI bottom out around 40. This changed in May 2018, when gold broke down through price support and the RSI broke below 40.
For now, I see gold in a long-term bullish configuration. If the RSI finds support around 40 during the next pullback, that could be a signal for further upside for the yellow metal.
RR#6,
Dave
Learn more about my research over at Sierra Alpha.
Twitter: @DKellerCMT
Any opinions expressed herein are solely those of the author, and do not in any way represent the views or opinions of any other person or entity.


 Flirting With Critical Support… Again")