Tiffany & Company (TIF) traded down by 6% this morning, after initially trading higher in extended hours yesterday afternoon.
The luxury jewelry retailer reported earnings per share of $1.67 and total revenue of $1.33 billion, compared to estimates of $1.63 and $1.3 billion.
Tiffany & Co also reported same store sales growth of 3%, compared to estimates of 2.8%. However, European sales were disappointing, which may have contributed to the downward break.
Tiffany & Co (TIF)… A Little More To Go Before It’s a Buy?
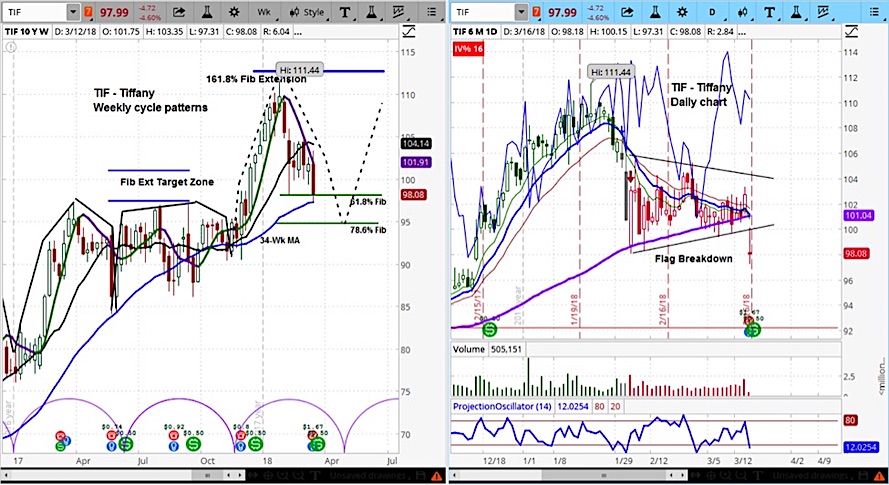
Our analysis of TIF’s market cycles indicates the current correction may continue into late April, with a target below $95. Note the bear flag break on the daily chart.
The market cycles are designated by the semicircles at the bottom of the weekly chart.
Tiffany & Company (TIF) Stock Charts with Weekly (L) and Daily (R) Bars
For an introduction to cycle analysis, check out a clip of our Big Picture Analysis, or visit askSlim.com and become a free Level 1 member for the full version.
Twitter: @askslim
Any opinions expressed herein are solely those of the author, and do not in any way represent the views or opinions of any other person or entity.


: Showing Some Signs of Emerging Strength")
