
First some facts about the July Calendar Range
The July Pattern
The Six-Month Calendar Ranges
- Provides directional bias for the next 6 to 12 months.
- January and July divide the year
- Simple levels that matter + the right indicators and tactics.
Overall, we look at 2 simple things.
- If an instrument breaks out of the range or breaks below with momentum and price and then has follow through.
- If an instrument breaks out or down and then reverses back into the calendar range high and low.
The chart at the header shows the S&P 500 (NYSEARCA: SPY) in 2023-2024.
Note that in January 2024, the S&P 500 (SPY) broke the calendar range and soared. But by July 2024, with the new calendar range, SPY could not clear it and thus began to sell of testing the July calendar range low.
This July calendar range re-set for the Russell 2000 (IWM) and Retail Sector (XRT) will be important.

This is a daily chart of IWM.
The arrows show the January 6-month calendar range high (green) and low (red).
When the July range sets this week, we will be watching the direction the small caps head in.
Was 226.05 the July calendar range high (made last week)?
Was 214.15 the low made on July 1st?
The bigger point is that regardless of what the SPY does (and that too will establish its new range), small caps will help us see the macro narrative for the summer and perhaps for the balance of 2025.
Calendar ranges are a powerful indicator that illustrates the next trend direction.
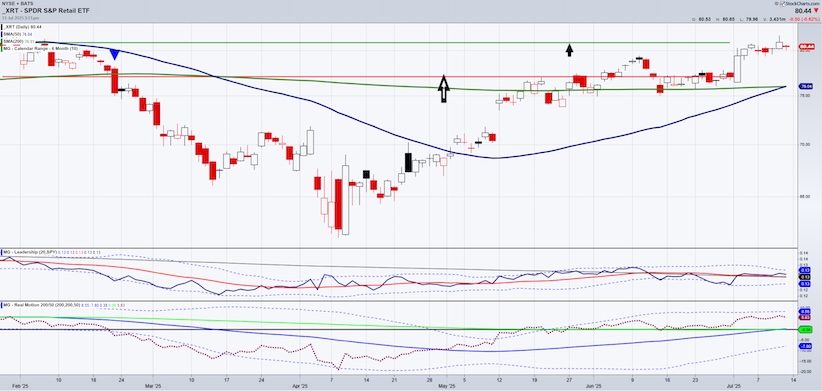
The chart of Retail (XRT) will most likely have the final say of what the rest of the summer looks like for the overall market.
With rising metal, oil and gas prices, along with tariffs, and stubbornly high interest rates, can the consumer hang in there?
Like IWM, the January calendar range never cleared to the upside.
In February 2025, XRT handily failed the January 6-month calendar range low, which clearly led to the trough in April.
Now, July 1st XRT made a low of 76.46. The high thus far has been 81.70.
Meanwhile, momentum and the price moving averages are about to have a golden cross or Granny could return to a bullish phase.
Therefore, a move over July highs is a good sign, while the area around the July lows and the 50 and 200-DMA are the essential support areas.
A range will be set for every instrument.
That means we will see some areas rally above the range, others fail and others, perhaps, chop around in that range until something helps them reconcile.
Twitter: @marketminute
The author may have a position in mentioned securities at the time of publication. Any opinions expressed herein are solely those of the author and do not represent the views or opinions of any other person or entity.


")