It can take time to determine what financial news to trust and who to follow with many conflicting market opinions and a 24-hour-driven news culture.
That’s one reason we use a rules-based methodology and quant modeling combined with our proprietary trading indicators to help us make informed decisions about where the market is headed next.
The Risk On / Risk Off Gauge is one example of how we utilize automated mechanical models. Our risk gauges are currently alerting us to a prospective trend shift, and because of this, traders should exercise caution.
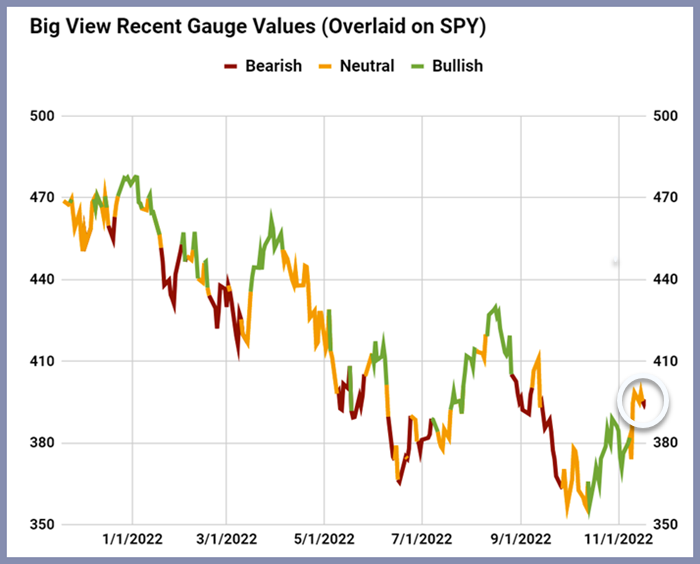
The Risk Gauge retreated to a risk-off reading. The Risk On / Risk Off Gauge is flashing a red bearish signal, making the environment conducive for risk management.
It does not mean the S&P 500 can’t go up by 200 more points, but the potential downside is a real possibility with limited upside.
Our risk gauge is based on five inter-market relationships and is available in our Big View Premium research service. The Gauge is intended to alert and confirm changes in trend strength.
The risk gauge suggests that the rally that began in Mid-October could turn into a correction soon.
We keep an eye on many other indicators and when viewed collectively they provide further insight.
The Risk On / Risk Off Gauge is now bearish changing from a bullish reading one month ago when the current rally began. One week ago, the gauge was neutral.
Last week the market became overbought before going sideways to modestly up this week, forming a short-term compression range across the indices.
The stock market traded mixed today as home sales fell and negative news about leading economic indicators weighed on corporate earnings.
The SPY and IWM bounced back modestly after a shaky week as Fed officials pushed back against a pause on monetary tightening.
The gauge is one daily indicator, and traders should follow the markets closely and pay attention to changes in technical strength.
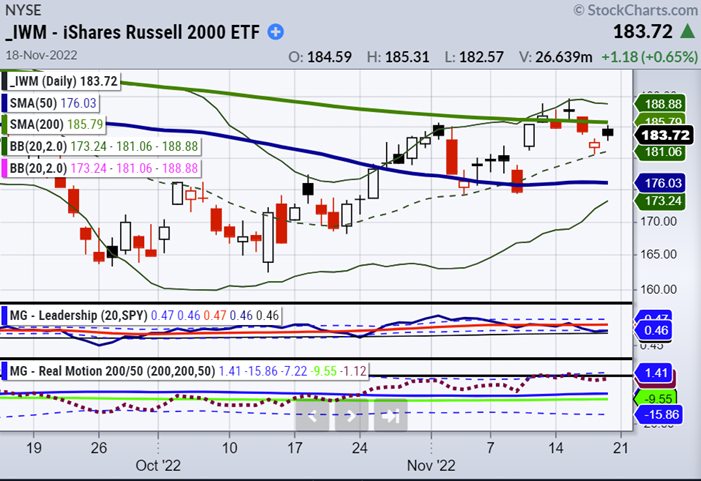
Grandpa Russell (IWM) had been one of the strongest indices over the past few weeks, but IWM closed this week back below the 200-day moving average and is showing signs of further weakness.
Several other Big View indicators are looming, and one to quickly mention is that the leading sectors for the week were all risk-off plays like utilities (XLU) and consumer staples (XLP). This is signaling an end to the current rally is near.
We understand that making money in today’s market is no easy task, but our proprietary research tools can help you succeed. With our trading indicators and risk analytics, you’ll be able to make money and trade confidently.
Mish in the Media:
CMC Markets 11-09-22What’s next for key sectors after US midterms?
Stock Market ETFs Trading Analysis & Summary:
S&P 500 (SPY) 393 support and 399 resistance
Russell 2000 (IWM) 179 support and 186 resistance
Dow (DIA) 333 support and 339 resistance
Nasdaq (QQQ) 281 support and 287 resistance
KRE (Regional Banks) 60 support and 65 resistance
SMH (Semiconductors) 214 support and 222 resistance
IYT (Transportation) 223 support and 228 resistance
IBB (Biotechnology) 130 support and 136 resistance
XRT (Retail) 63 support and 67 resistance
This article was contributed to by Keith Schneider and Wade Dawson.
Twitter: @marketminute
The author may have a position in mentioned securities at the time of publication. Any opinions expressed herein are solely those of the author and do not represent the views or opinions of any other person or entity.


