I have been talking about the numerous areas of price resistance converging near 2,800 on the S&P 500.
Well, that acted like a brick wall for the index.
The stock market clearly needed a reset based on my social media observations, which can be quite telling at times.
I was looking for a pullback to the 2,740 region as there is both chart and trendline support in that zone.
In the short term, there has been some minor damage with recent trends off the late May lows taken out by a couple stock market indices.
And based on some Elliott Wave counts, the current decline should end quickly, and the market should finally get into some sustainable/consistent uptrend (lockout rally) that we have been talking about.
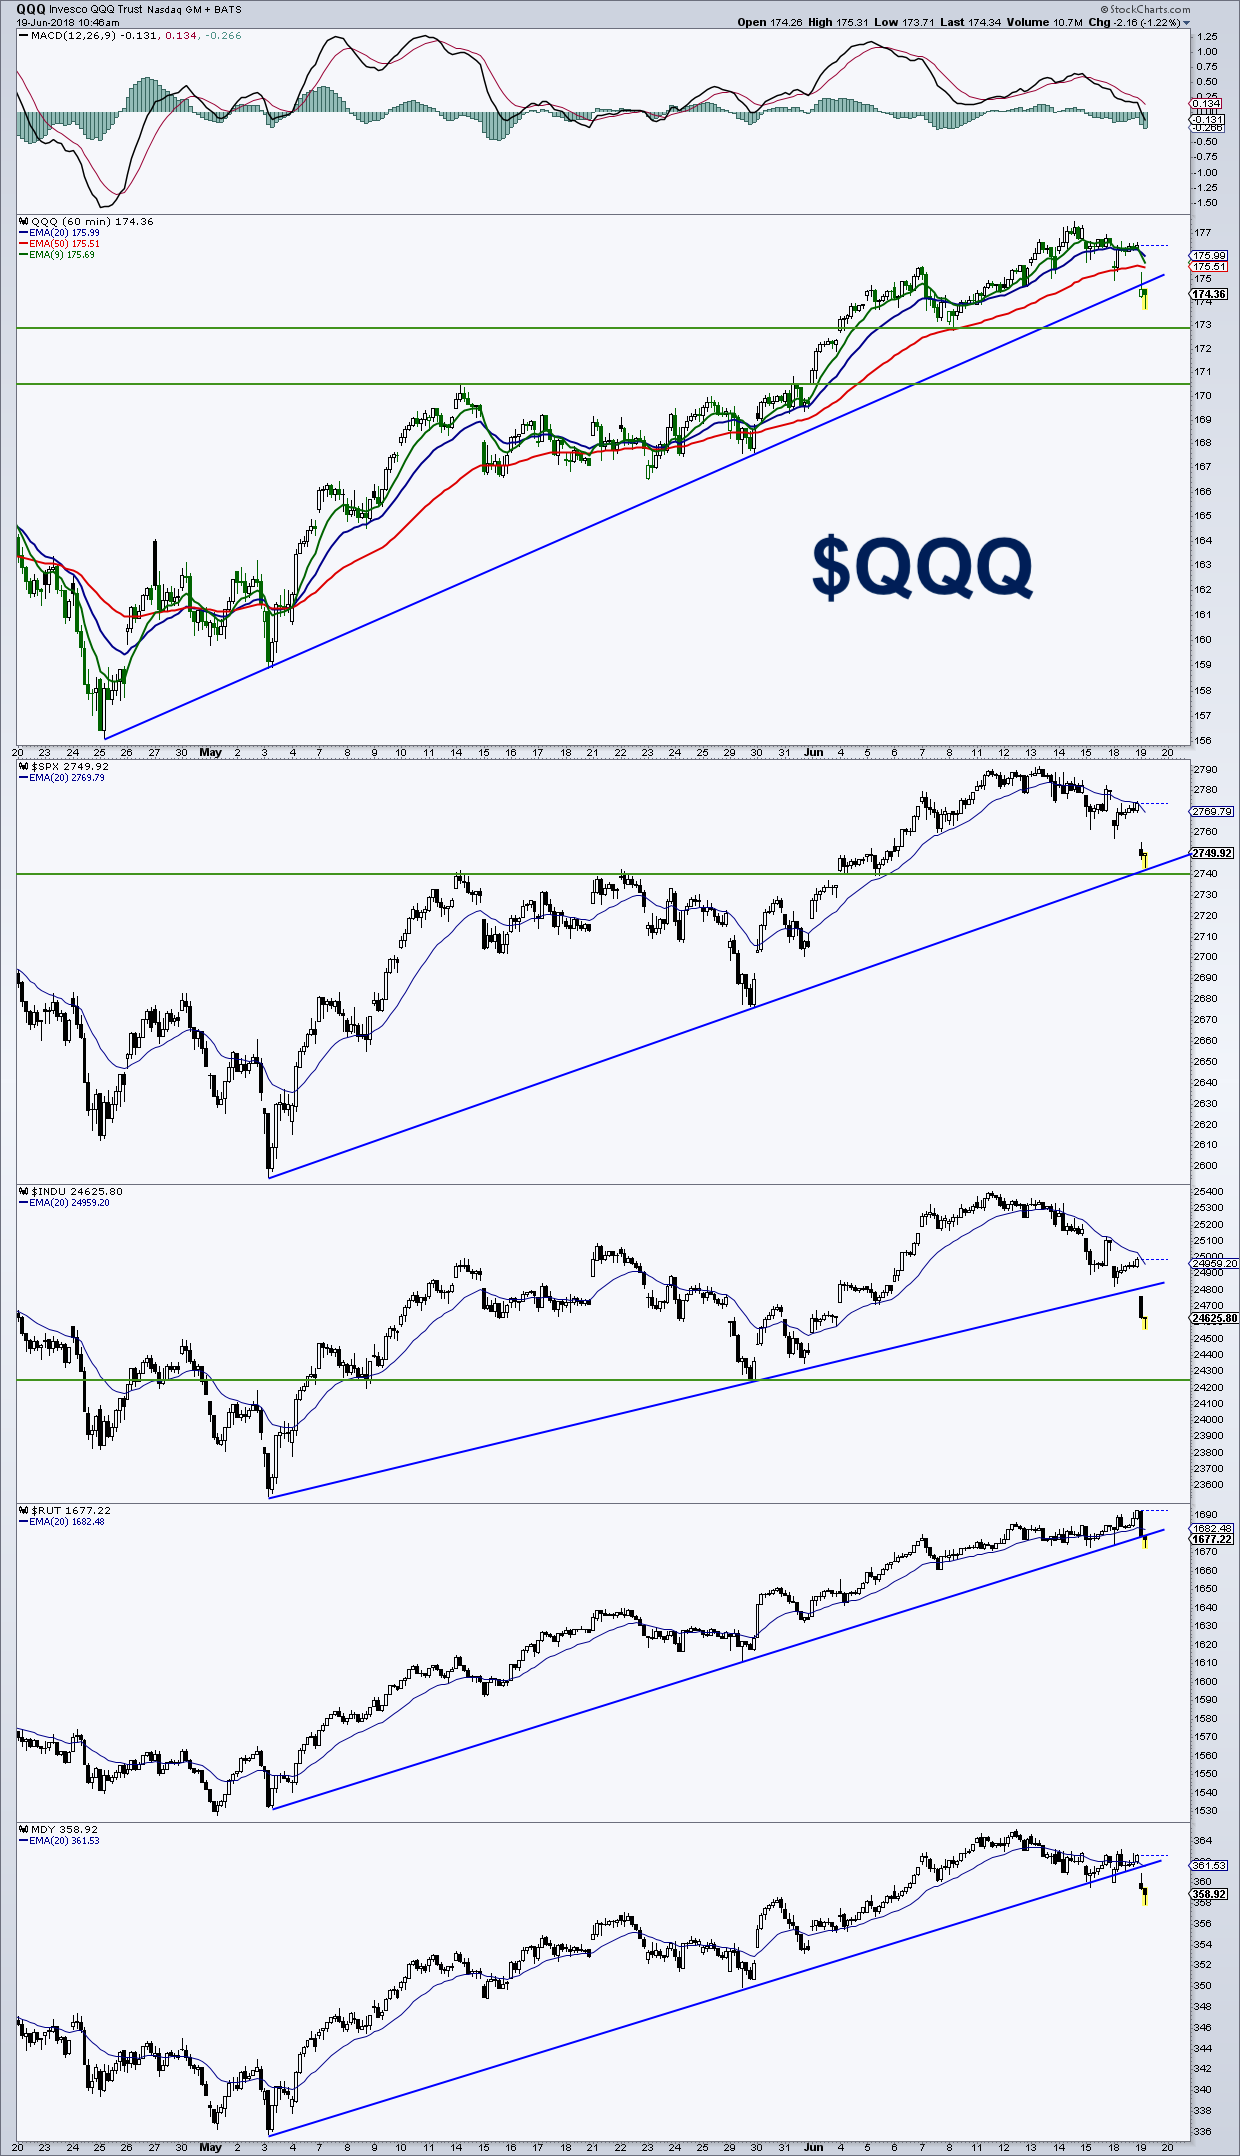
Below is a chart of the Nasdaq 100 ETF (QQQ), along with several other stock indices, looking at the near-term trend line.
PowerShares QQQ Trust and Various Stock Indices
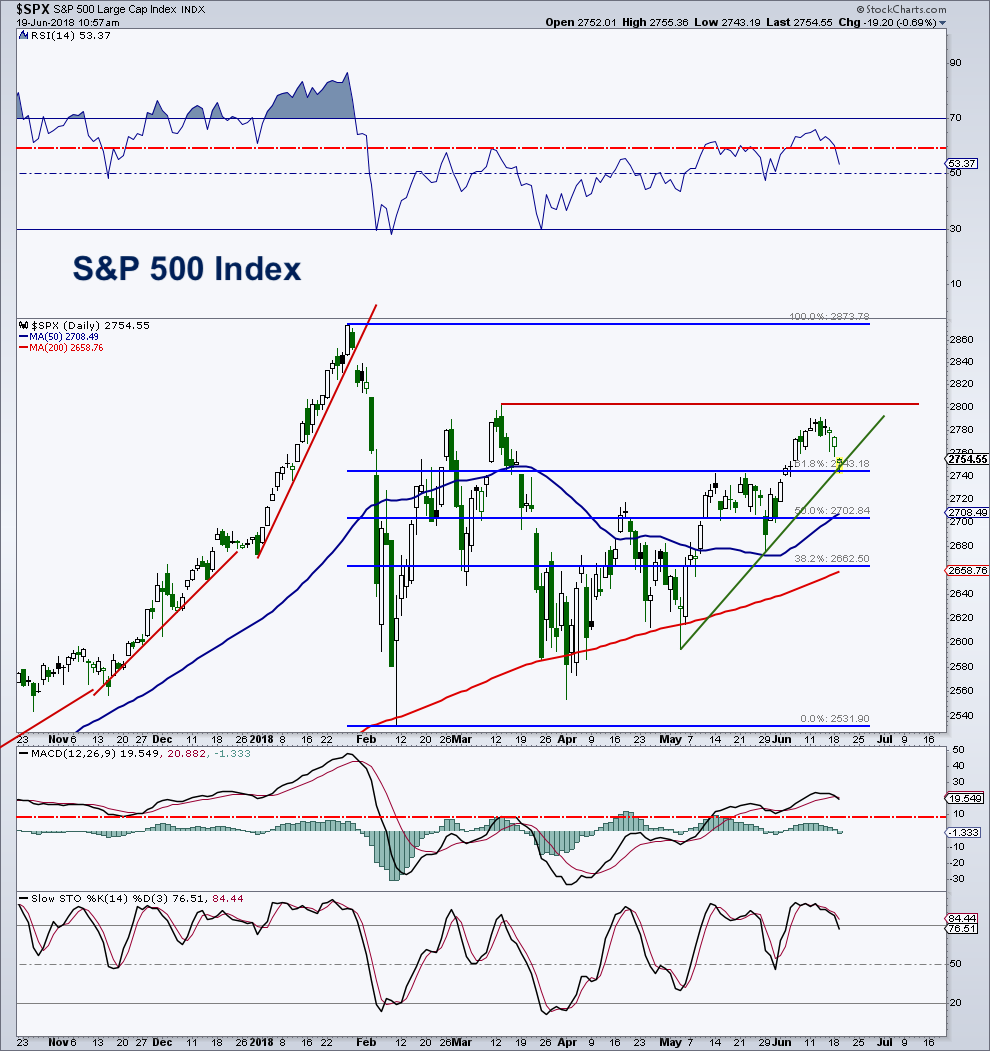
On the daily “500” chart, note the backtest of the breakout area near 2,740. With this reset, the index should now be able to take out all that resistance near 2,800 on its way to new highs.
S&P 500 Index
Feel free to reach out to me at arbetermark@gmail.com for inquiries about my newsletter “On The Mark”. Thanks for reading.
Twitter: @MarkArbeter
The author may have a position in mentioned securities at the time of publication. Any opinions expressed herein are solely those of the author, and do not in any way represent the views or opinions of any other person or entity.


