This article was contributed to by Keith Schneider and Wade Dawson.
The VanEck Semiconductor ETF (SMH) displays Leadership with our Triple Play indicator and strong momentum according to our Real Motion indicator.
Semiconductors are an essential part of our daily lives, a geopolitical football of national security interests, and chips are increasingly in demand.
Meet Sister Semiconductor (SMH), also known in trading circles as the VanEck Semiconductor ETF (SMH). SMH potentially indicates new leadership in the beaten-down tech industry.
Today institutional investment managers released their 13 F filings and sometimes disclosures provide insights.
Warren Buffett’s Berkshire Hathaway (BRKB) disclosed today that it bought a $4 billion stake in Taiwanese chip giant TSMC (TSM).
Why is this significant?
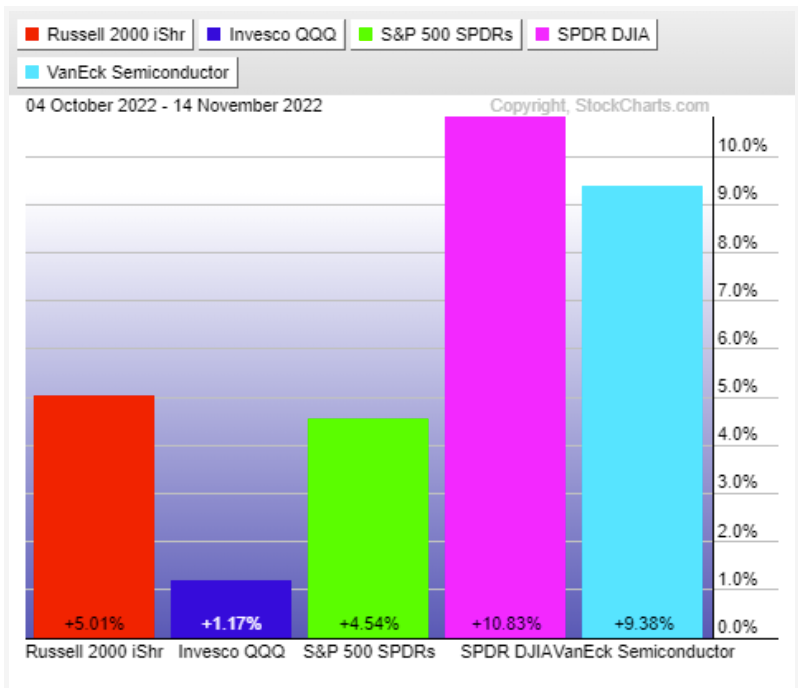
Stock market returns from October 04 to November 14.
Many semiconductor companies outsource the manufacturing of their components to TSMC.
TSMC is also the No. 1 holding in the VanEck Semiconductor ETF (SMH) and a Taiwanese firm which brings additional geopolitical risk.
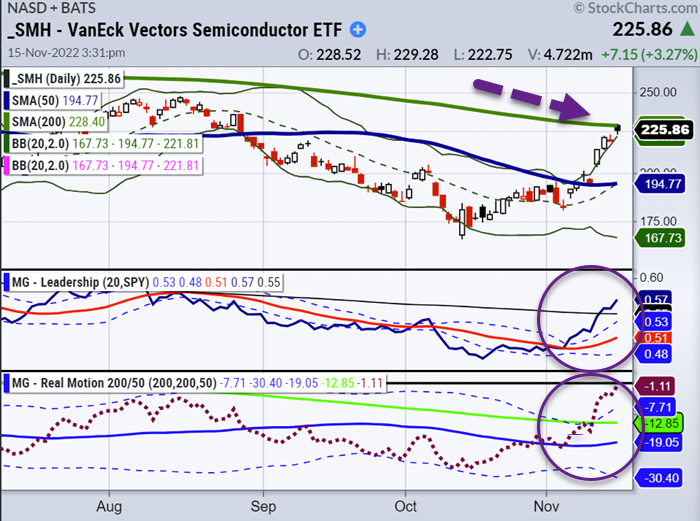
SMH is breaking out of a consolidation pattern. SMH is about to regain the 200-day moving average and closed just below it.
SMH crossed the 50-day moving average at the beginning of the month, and we might see a significant shift in the chip market if SMH can cross the 200-day moving average and hold this higher price level.
SMH CHART
Semis are in increasing demand, and in the past, Sister Semiconductor (SMH) was one indicator of technology rebounding.
The Real Motion Indicator and Triple Play Indicator on SMH show that the momentum, price, and volume trends indicate potential bullishness.
The Triple Play indicator is a strong signal of market leadership, but SMH is also running rich on the Real Motion Indicator.
This could lead to a breakout above the 200-day moving average, but this could also be a risky trade as SMH is subject to potential mean reversion.
So far, the bear market in semis has lasted longer than expected, so traders need to keep an eye on these indicators to position trades correctly.
Keep an eye on SMH to have a better understanding of where technology and the semiconductor business are headed next.
Stock Market ETFs Trading Analysis & Summary:
S&P 500 (SPY) 396 support and 402 resistance
Russell 2000 (IWM) 185 support and 188 resistance
Dow (DIA) 333 support and 339 resistance
Nasdaq (QQQ) 286 support and 293 resistance
KRE (Regional Banks) 62 support and 67 resistance
SMH (Semiconductors) 221 support and 229 resistance
IYT (Transportation) 227 support and 233 resistance
IBB (Biotechnology) 133 support and 137 resistance
XRT (Retail) 64 support and 69 resistance
Twitter: @marketminute
The author may have a position in mentioned securities at the time of publication. Any opinions expressed herein are solely those of the author and do not represent the views or opinions of any other person or entity.


