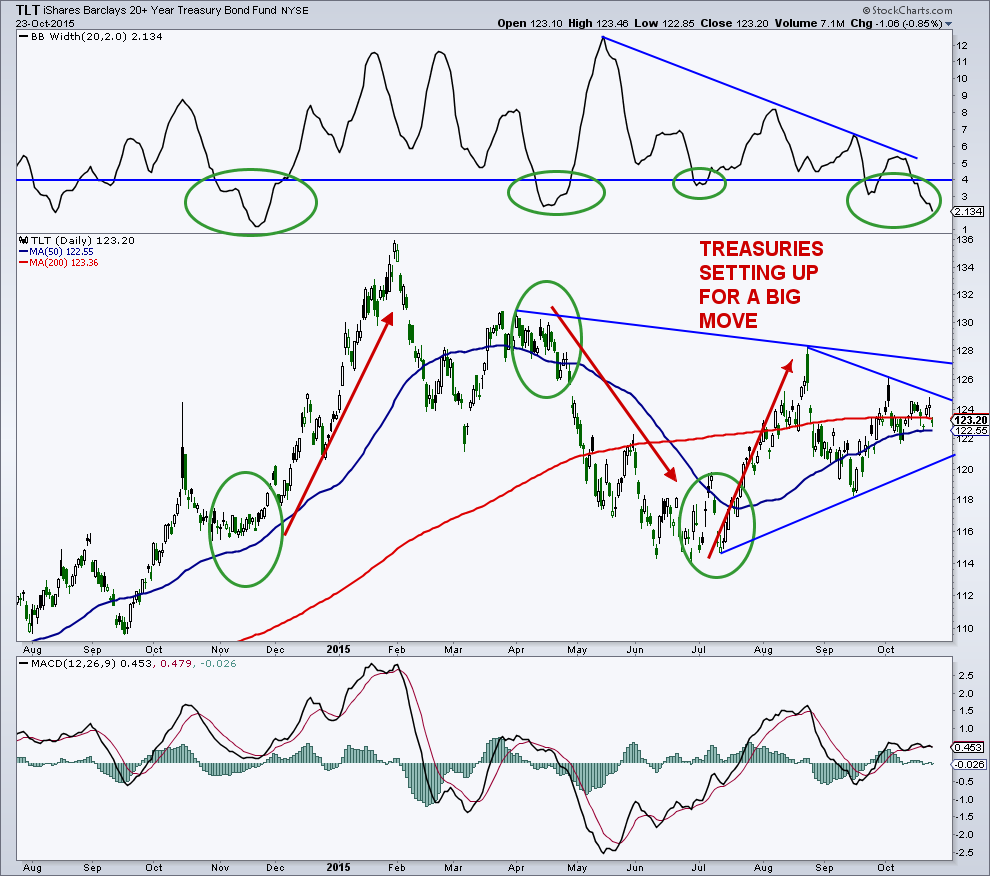
The chart of the iShares 20+ Year Treasury Bond ETF (TLT) continues to confuse many investors. Other than pointing out key support and resistance, the only thing I can say is that the price action is compressing, so a big move is probably coming.
The daily Bollinger Bands fell below 4% again and looking at recent history, this has led to some pretty good moves, both up and down for the treasury bond ETF.
For the bulls, TLT needs to take out trendline and chart resistance up in the 127/128 area.
On the flip side, for a big break lower to occur, trendline support at 120 and chart support near 118 would have to give way. See daily chart below.
20+ Year Treasury Bond ETF (TLT) Daily Chart
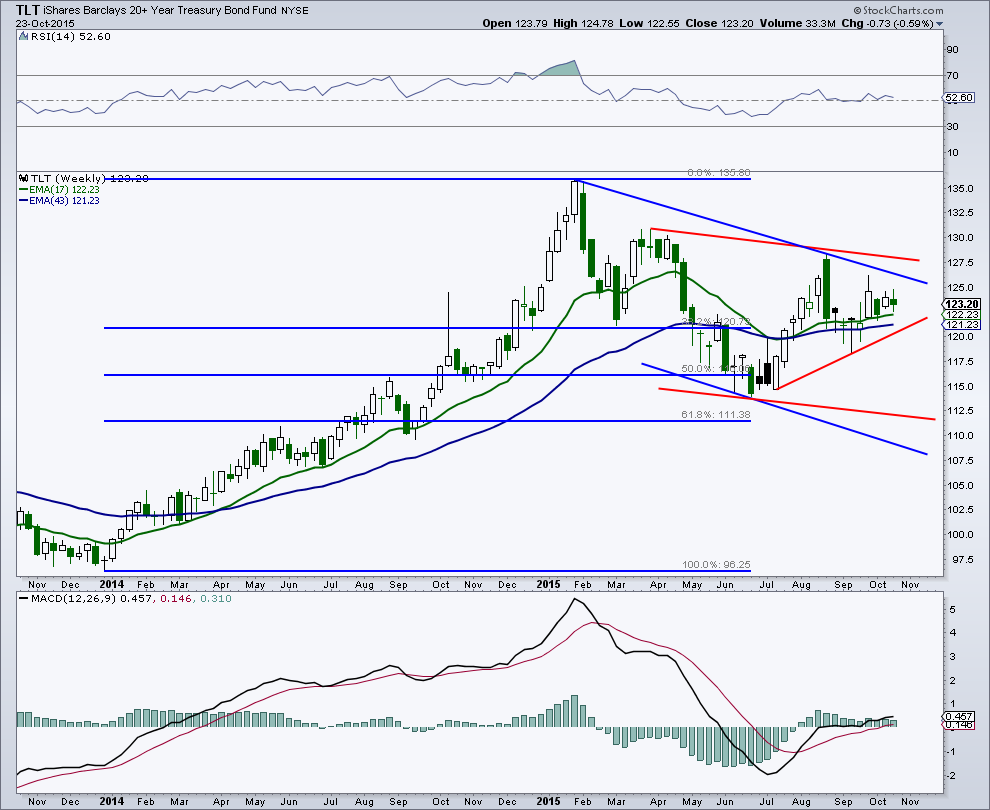
The weekly chart for this treasury bond ETF shows a higher low, but a lower high, so patience is important here until we see a confirmed break either way.
The Commitment of Trader’s (COT) data may finally be giving us something for this market. “Smart money” commercials have reduced their net futures position over 300,000 contracts since late 2014, and are now holding their lowest net position since May 2013. At the same time, “dumb money” small speculators have increased their net futures position about 130,000 contracts since June and are at one of their most bullish positions in the past couple of years. Keep a close eye on treasury bonds as this could get interesting (and volatile) in the days ahead.
20+ Year Treasury Bond ETF (TLT) Weekly Chart
Thanks for reading and good luck out there.
Twitter: @MarkArbeter
The author does not have a position in any mentioned securities at the time of publication. Any opinions expressed herein are solely those of the author, and do not in any way represent the views or opinions of any other person or entity.


: Showing Some Signs of Emerging Strength")
