The S&P 500 was sharply oversold last week according to Our Big View weekly analysis. Hence the market bounced and cleared the 50-day moving average in all indices.
The macro backdrop for the financial system remains the same. However, with all the headwinds, can this bounce last?
First and foremost, nothing about the market’s underlying fundamentals has changed.
According to the latest Refinitiv Lipper fund flow report, sellers retracted $17.5B from conventional exchange-traded funds last week. Leading the outflows were equity funds and money market fund. This marks the second straight week of outflows for both.
The fixed income ETF losers were SPDR Bloomberg High Yield Bond ETF (JNK) and the iShares iBoxx $ Investment Grade Corporate Bond ETF (LQD), as they also observed the most significant weekly outflows.
With that said, junk bonds have been an extraordinarily reliable lead indicator for risk on/risk/neutral/risk off.
To start the heavy stat driven week, what do we need junk bonds to do in order to see the equity rally continue?
Junk bonds deliver higher yields on investments as the companies in the ETF generally tend to have poor balance sheets. Therefore, if bond traders are buying junk bonds, they have confidence the market will go up.
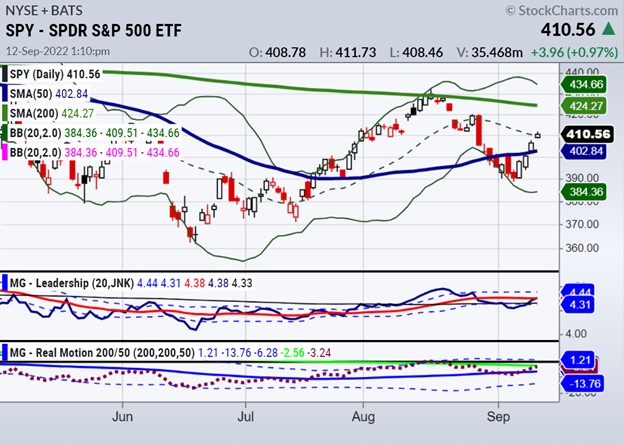
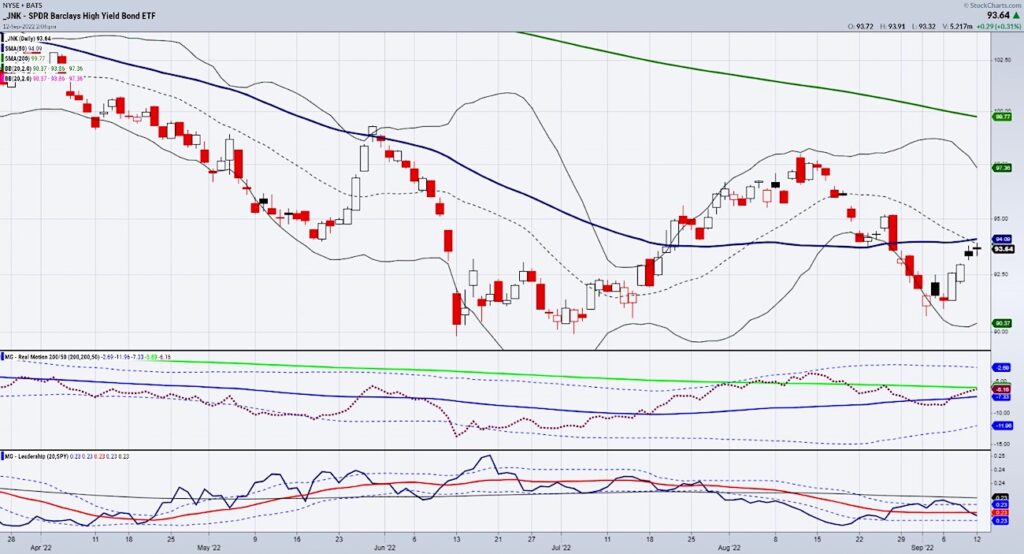
The chart shows that while SPY is above the blue line or 50-DMA, junk bonds (JNK) are not quite there.
If some of the headwinds turn out not so disruptive (CPI lower, rail strike averted, rates remain stable, dollar does not get stronger), then we will see it in the chart of JNK.
The 50-DMA will penetrate which will embolden bulls further, possibly taking SPY closer to 420.
However, should JNK roll over and break under 93.00, we will consider that a warning to the bulls.
Investors should always keep an eye on fund flow data when making investment decisions. It can provide valuable insights into other market participants’ feelings about a particular asset class or sector.
Traders can gain an advantage in the market by using MarketGauge’s proprietary technical analysis tools, such as the triple play indicator, comparable market phases, downward momentum, volume analysis, and positive trend strength (TSI), and used in conjunction with the Modern Family to make better-informed trading decisions.
To learn more about how to identify trend changes using indicators and the Modern Family, reach out via chat, phone, email, or book a call with Rob Quinn, our Chief Strategy Consultant, by clicking here.
Mish’s Upcoming Seminars
ChartCon 2022 Stockcharts October 7-8th Seattle.
Join me and 16 other elite market experts for live trading rooms, fireside chats, and panel discussions
Stock Market ETFs Trading Analysis & Summary
S&P 500 (SPY) 408.82 support and resistance 413.55
Russell 2000 (IWM) 187.29 support and resistance 190.84
Dow Jones Industrials (DIA) Support at 322.04 and resistance 326.62
Nasdaq (QQQ) Support at 309.61 at resistance at 312.61
KRE (Regional Banks) Support at 64.12 resistance at 65.20
SMH (Semiconductors) 213 support and resistance at 220
IYT (Transportation) 236.82 support and 238.75 resistance
IBB (Biotechnology) 127.12 support 128.52 resistance
XRT (Retail) support at 66.47 and 67.75 is resistance
Twitter: @marketminute
The author may have a position in mentioned securities at the time of publication. Any opinions expressed herein are solely those of the author and do not represent the views or opinions of any other person or entity.

: Showing Some Signs of Emerging Strength")
