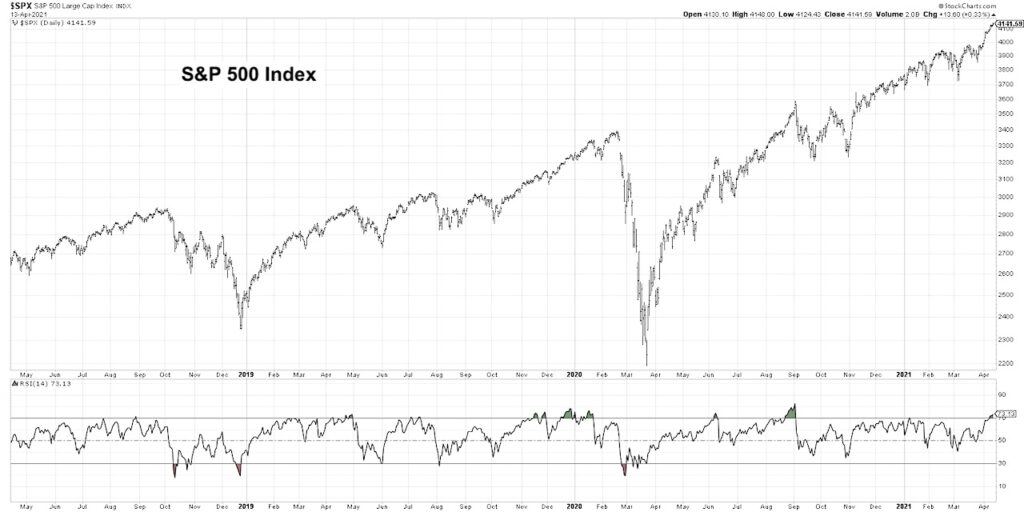
“Overbought means up a lot.” The Relative Strength Index, or RSI, shows a security’s price momentum relative to its normal price trajectory.
The S&P 500 index recently became overbought for the third time in the last 12 months. What does this mean for the short-term and long-term prospects for stocks?
In today’s video, we’ll look at what overbought conditions mean for the S&P 500 index and focus on some of the historical trends following previous overbought conditions. While the S&P 500 has often pulled back soon after becoming overbought, the long-term implications are actually quite positive!
– How overbought conditions in June and August of last year indicated uptrend exhaustion and potential for short-term downside
– Why overbought conditions are actually bullish indications for long-term strength of the price trend
– How the S&P 500’s current upswing relates to the leadership rotation between growth and value stocks
For deeper dives into market awareness, investor psychology and routines, check out my YouTube channel!
One Chart: The S&P 500 Index [VIDEO]
Twitter: @DKellerCMT
The author may have positions in mentioned securities at the time of publication. Any opinions expressed herein are solely those of the author, and do not in any way represent the views or opinions of any other person or entity.


 Flirting With Critical Support… Again")


