In an effort to make things easier to digest, I’ve decided to split the Rotation Report into two segments running bi-weekly. The Rotation Report will alternate betweet market rotation and group action and a Macro Market Outlook.
This week we’ll start off with the Macro Market Outlook. Let’s start with market internals.
Market Internals
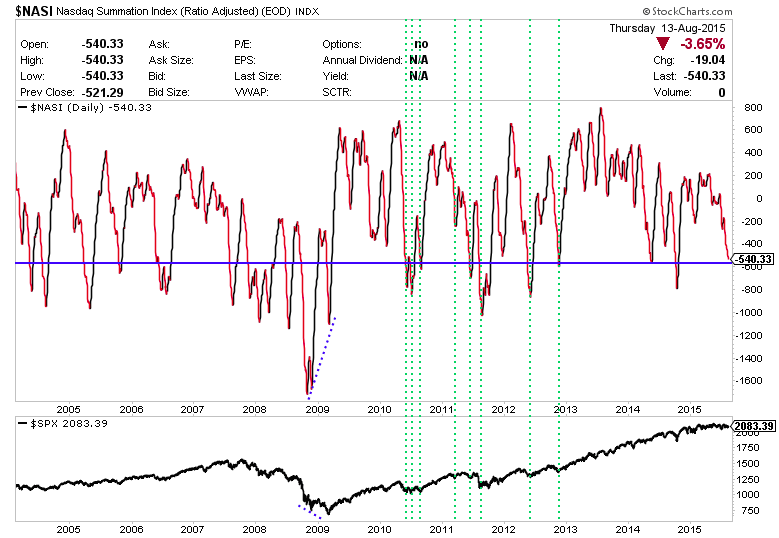
The NASDAQ Summation Index is reaching that of other key lows in the market.
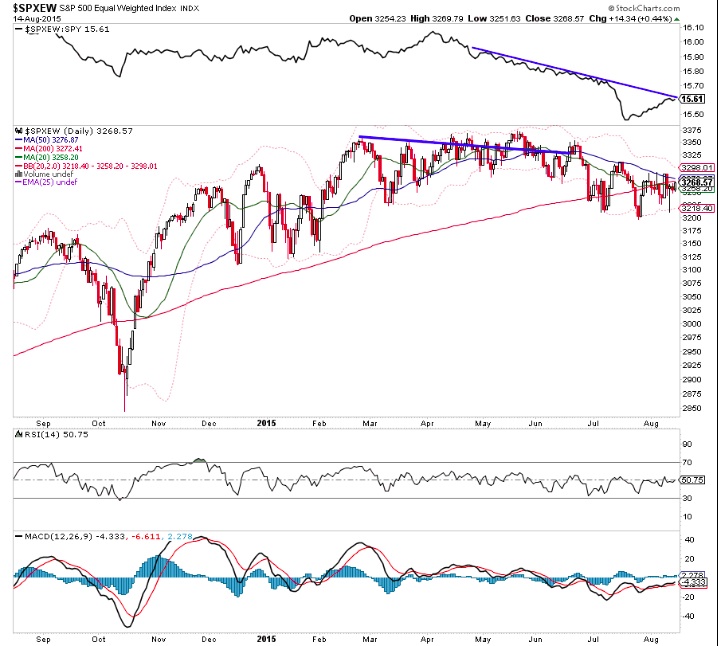
S&P 500 market breadth has improved over the last couple of weeks following a climactic drop. It hasn’t quite broken the downtrend yet, though (see the top subgraph).
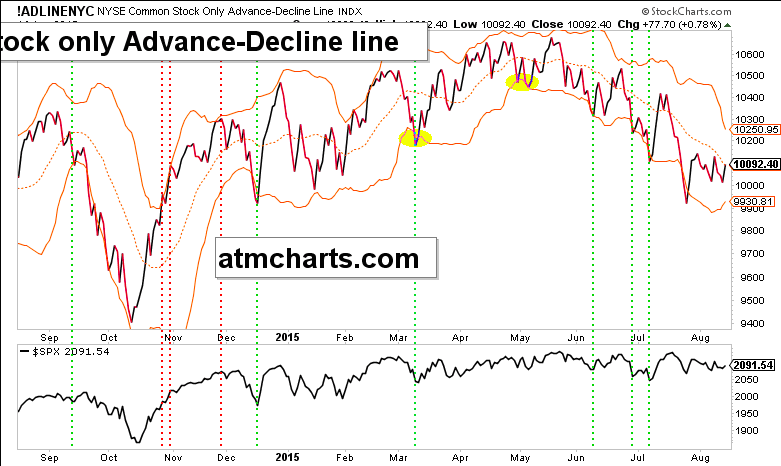
Note as well that the stock only advance-decline line is firming up as the lower bollinger band is now pointing higher. This is an interesting development and could lead stocks higher this week. Taken together, the sum of these indicators tilt the market outlook towards the bulls this week.
Mid-week I wrote this post “Something’s Got To Give” on market sentiment – it’s been tough to get a handle on lately.
Bonds
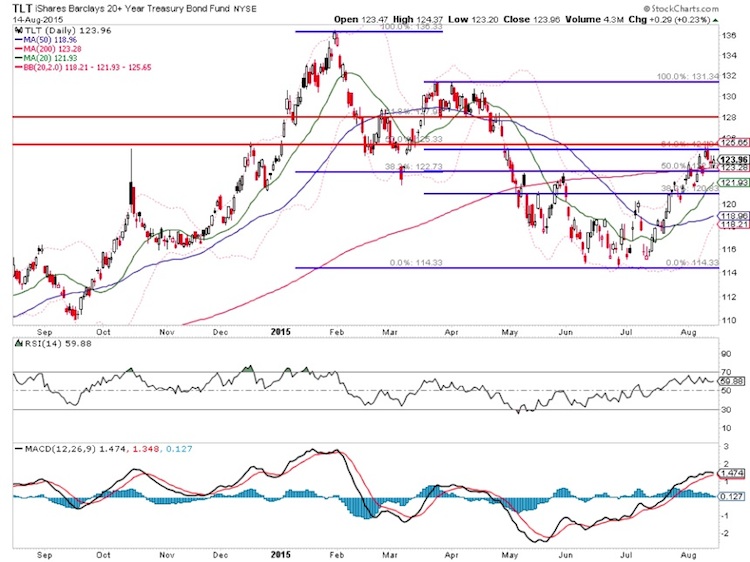
Long Term Treasuries (via the TLT) are testing a thick resistance zone. This should be on investors radars this week. The longer this level holds, the better for stocks. But if it fails to hold…
Commodities
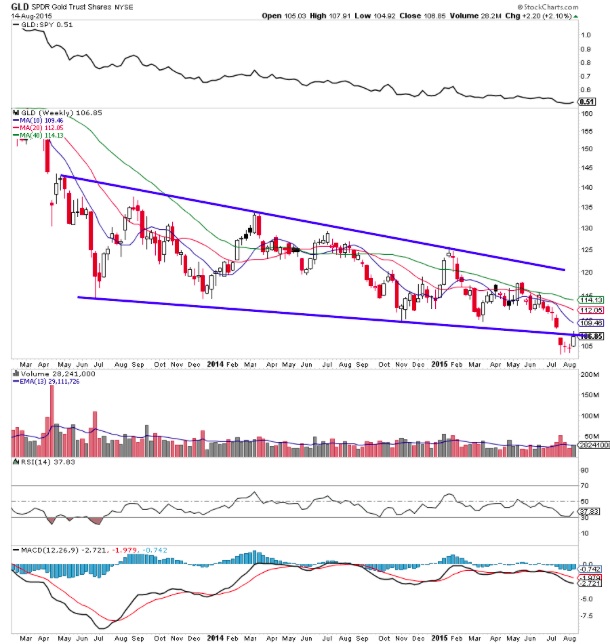
Gold has turned the corner in the short-term. How will Gold hold up this week?
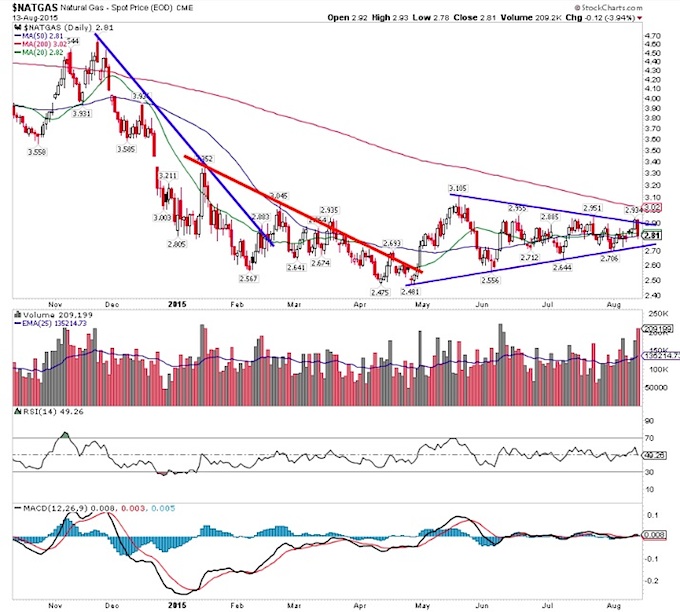
The falling 200 day moving average has just about caught up to price in Natural Gas. Keep an eye on the rising support line. If Nat Gas can break higher, there is a tremendous seasonality tailwind that points higher come September.
S&P 500
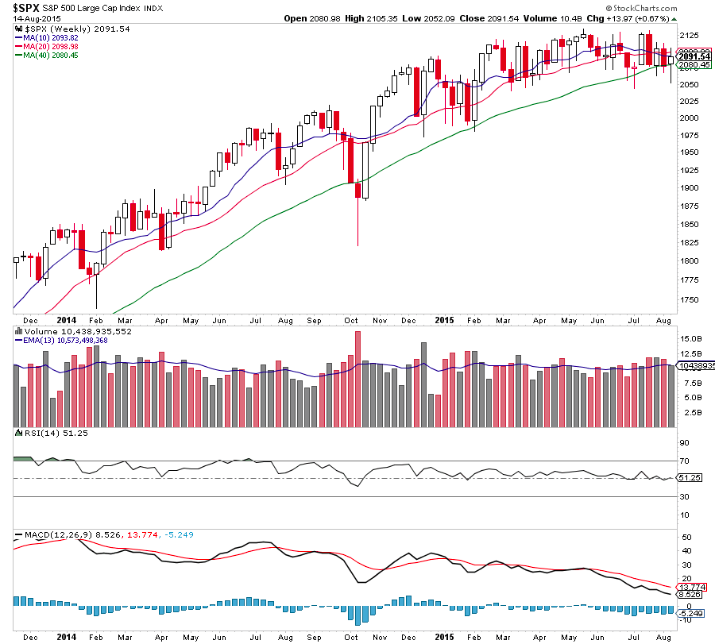
Amazingly, the S&P 500 held its 40 week moving average yet again.
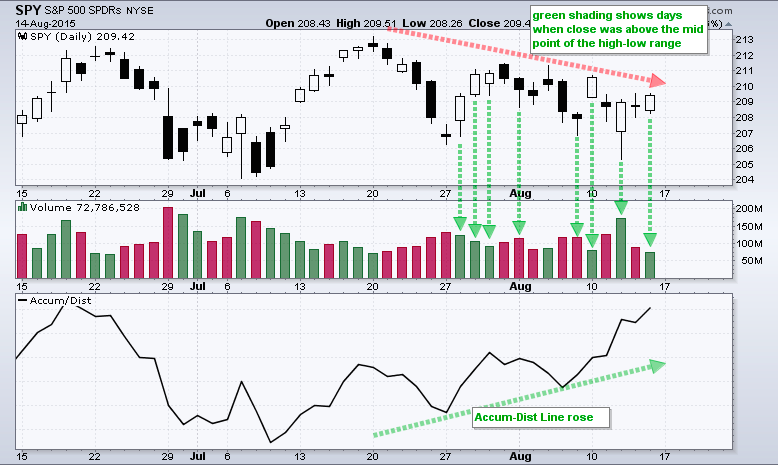
Arthur Hill notes signs of accumulation in the S&P 500 as the accumulation – distribution line reaches two month highs.
Thanks for reading and trade em well!
Twitter: @ATMcharts
Read more from Aaron on his blog.
No position in any of the mentioned securities at the time of publication. Any opinions expressed herein are solely those of the author, and do not in any way represent the views or opinions of any other person or entity.


: Showing Some Signs of Emerging Strength")
