My pal Callum Thomas is one of my favorite follows on StockTwits. Every Saturday night he compiles what he calls his #ChartStorm. It is a list of 10 of his favorite market charts he sees all week. What I like about Callum is he uses a variety of methods to form a conclusion. Some technical, some sentiment, some fundamental, etc. I always like to say there is no wrong way to make money and I try my best to look at various things, but probably put about 75% of my focus on sentiment and quantified data. The other 25% could be anything from Fibonacci retracements to moon cycles. I’m serious, I will use anything if I think it is an edge. In the end, I’m looking for market charts/data others simply aren’t interested in using. That is my edge. Today I will share some of the 25% I like to use.
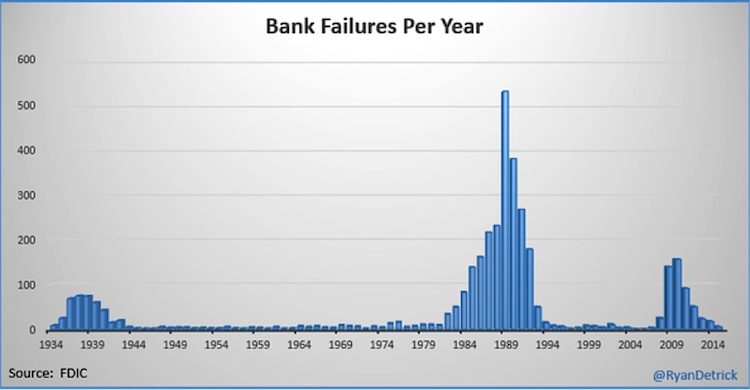
With that, I made his #ChartStorm this week with a chart of how many banks/institutions have failed over the past year. It is clear down to six, which is the lowest since 2007. I like to look at market charts like this as a sign of how the economy might be doing. Think about it, if banks are failing – things can’t be good. This is more art than science for sure, but I get all this data from the St. Louis Fed and once it is updated, they alert me. I’d rather know than not now. The past few years of less and less banks failing was a sign things were improving. Plain and simple.
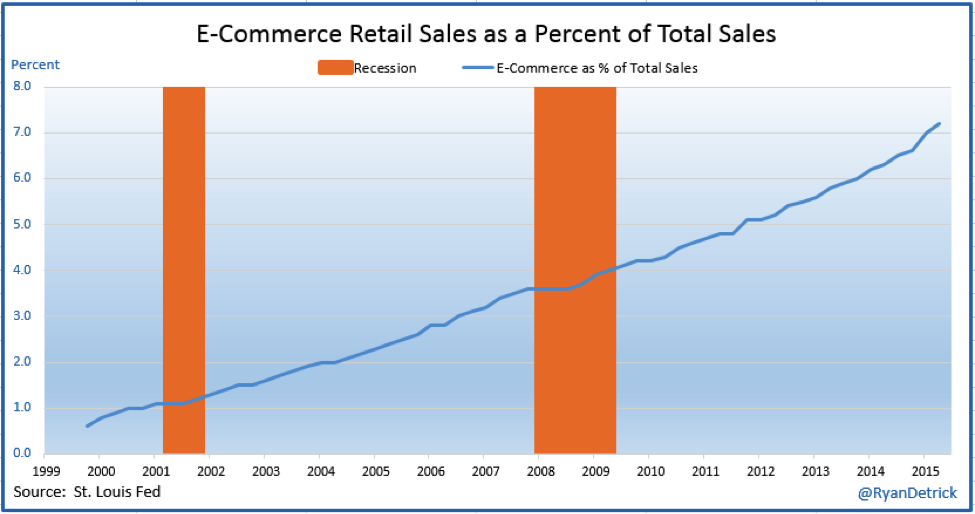
Another neat, but more off the beaten path market chart I follow is the percentage of retails sales that come from E-Commerce. This is another one that was just updated at the St. Louis Fed and I follow for clues as to how things are going. Turns out, 7.2% of all sales during the second quarter were done online. I’m not shocked, as the Detrick household is seriously more like 50% at this point. We have packages show up from Amazon probably 5 days a week. I like to think I’m helping them as the second best performing in the S&P 500 this year.
Incredibly, this hasn’t been down on a quarterly basis in 15 years! It was down a few times, but never lower. It was also one chart that I shared earlier this year as a reason to be bullish Amazon. Remember, the retail giant was lower last year and everyone was quick to point out it had never turned a profit. Well, as long as this was going up, I found that bullish for online retailers and specifically Amazon. This is a major change in shopping habits and one I don’t see slowing down anytime soon.
We all knew how poorly August has been the past 20 years. I was one of the guys sporting all the stats on it. Yet, when I look at the overall sentiment I continue to think there is way too much worry for a market about a percent from an all-time high. From sentiment polls showing bulls as low as we’ve seen in years, to huge outflows from US domestic funds, to the demand for bearish put options over bullish call options at the highest point in years, to the total short interest in the SPY at multi-year highs. All of this is what will fuel the next leg of the rally. These bearish bets will once again be proven wrong and when we breakout out of this historically boring range, it could be a nice move higher. Don’t buy the talk that the Yuan down a few percent as a reason to panic and sell everything.
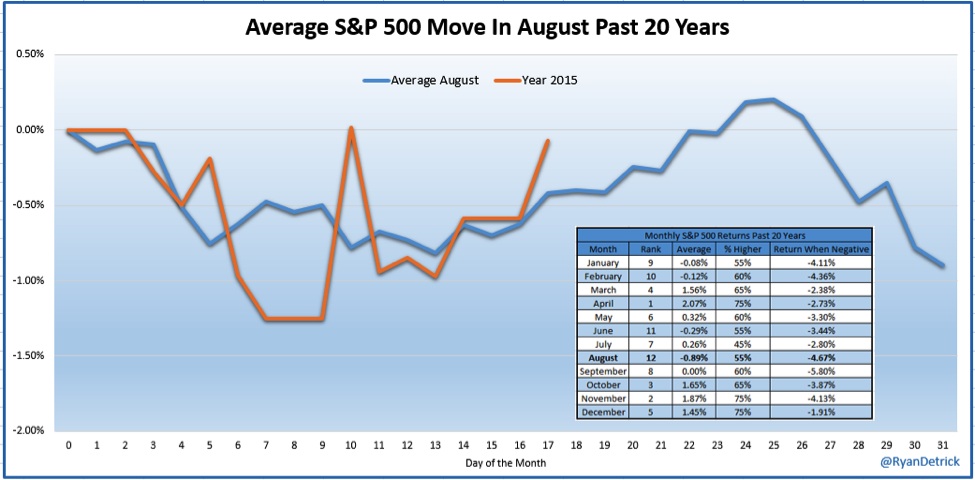
Lastly, here’s a chart of what August has done so far versus the 20 year average. Early weakness right on cue, now we are in the historically bullish part of the month. Will we see a late dip? With all the negatives the bears like to point out (think high margin debt, death crosses, etc.) and worry out there, my take is we could see a strong surprise August rally and the bears will once again be wrong.
Thanks for reading and good luck out there!
Twitter: @RyanDetrick
Any opinions expressed herein are solely those of the author, and do not in any way represent the views or opinions of any other person or entity.


