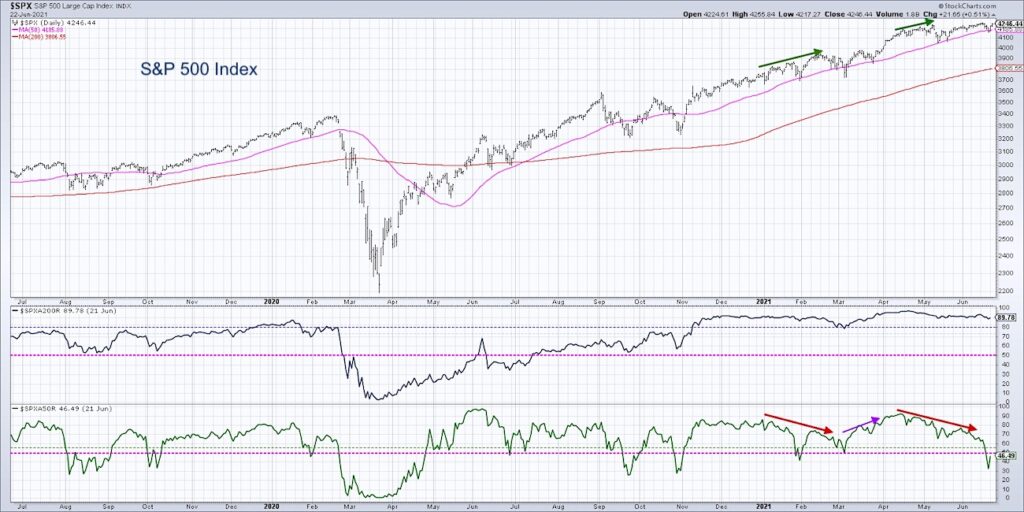
While the S&P 500 index has bounced off its own 50-day moving average, many of the S&P members have already broken down through their own 50-day.
Why is this chart the most important one for bulls to follow, and how can we differentiate buyable pullbacks versus deeper corrections in price and/or time?
In today’s video, we’ll discuss why many institutional investors use the 50-day moving average to identify actionable pullbacks. We’ll also discuss how turning the 50-day moving average into a breadth indicator can help anticipate periods of internal market weakness, even as the broad market moves higher.
– What happened when this breadth indicator had broken below 50% during previous bull cycles?
– What can the weakening breadth conditions tell us about the character of the overall market?
– What’s the “line in the sand” that bulls should focus on to confirm a rotation from accumulation phase to distribution phase?
For deeper dives into market awareness, investor psychology and routines, check out my YouTube channel!
One Chart: S&P 500 Index – Divergences
S&P 500 Index Divergences Chart
Twitter: @DKellerCMT
The author may have positions in mentioned securities at the time of publication. Any opinions expressed herein are solely those of the author, and do not in any way represent the views or opinions of any other person or entity.

: Showing Some Signs of Emerging Strength")

