After threatening to fail several times yesterday, S&P 500 futures (ES_F) began a recovery that appears to be holding. Trouble is, the momentum sitting around these moves is still very weak.
I expect expansion up over the coming days then a collapse of price into support once more. Price resistance sits near 2027.75. We have a slightly bullish formation in the shorter cycles and time frames of the charts.
The first price support is 2007 with further support below at the 2004.75 mark from yesterday; and price resistance near 2027.75 after the recapture and retest of 2013.75 mentioned the day before. Momentum readings are still negative but rising slightly– that means bigger resistance levels above should hold – and a lower high is still likely after this move up.
We have begun a small pattern of higher lows and higher highs on the futures, signaling a break in downside rotation and a return to upward motion in smaller wave patterns – consider the one hour chart for this to continue and make sure you watch resistance. To me, the decision zone still sits near, the retest of 2004 – if it holds, S&P 500 futures will have a shot at reversing the fall downward.
Shorter time frame momentum indicators are negative but rising, and higher than Monday. Longer cycles are downward trending, and in negative territory.
See today’s economic calendar with a rundown of releases.
RANGE OF TUESDAY’S MOTION
Crude Oil Futures (CL_F)
Morning motion is range bound for this one today. I see support levels for Crude Oil futures (Feb) between 35.90 and 36.26. Though I still anticipate further downside, I see very jagged price action continuing as I have mentioned, so we could still pop sharply before reversing. Just follow your moving averages on tight time frames – keep it simple and pay attention to price resistance levels for entry points short into support. If support begins to rise, well, you know you’ve got upside pending. I’m staging trades off support and resistance and not anticipating continuation. It has been working well.
Short-term price support for Crude Oil futures sits at 35.9. Resistance lies near 36.4, then 36.8, if that is breached and holds. For an intraday trading formation, we see a range event between 35.9 and 36.16, noting that momentum and trend are both neutral to bearish, and divergent to the rising prices in shorter time frames. Breach above a 36.16 sends us to congestion near 36.3-36.4. If we hold that, the move sends us to 36.6-36.8, then 37.14 and perhaps 37.7. Charts remain very muddy and congested. Below a 35.9 failed retest sends us to 35.35, 35.15, 34.8 and perhaps 34.5. Momentum on longer time frames is mixed and falling.
E-mini S&P 500 Futures (ES_F)
This week’s chart with active S&P 500 futures price support and resistance trading levels. Click to enlarge.
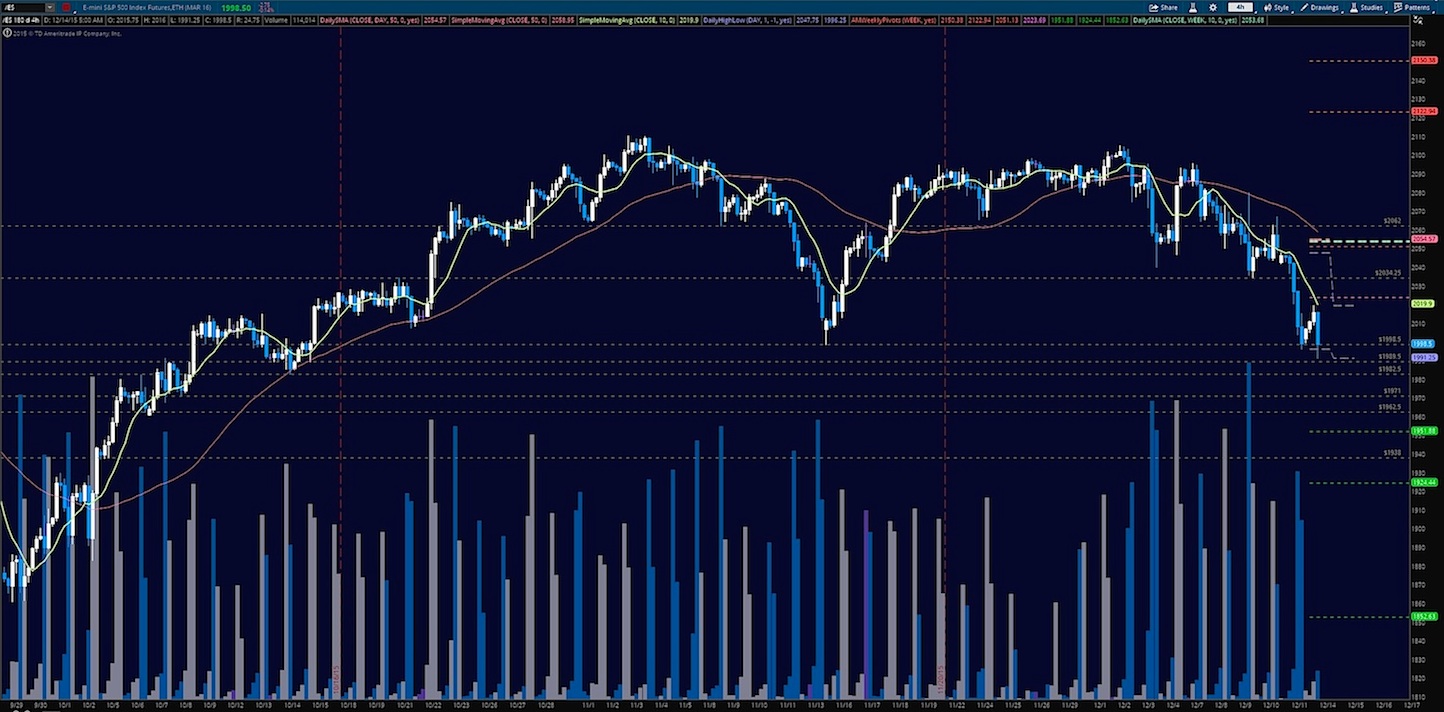
Upside motion is best setup on the bounce off the 2010 recovery – or a breach and positive retest of 2020. The long would be a trending move in short cycles but a countertrend one if looking at bigger time frames like the 4hour and above here -it appears we are still attempting a bounce. A breach and retest that holds off 2010 makes a reasonable setup but watch 2027 for sellers to advance their agenda. The breach of 2020 will likely bring excited buyers in but again, watch momentum carefully here. If momentum holds, we could see 2012.75, 2015.75, 2021, 2023, 2027.25, and 2030.5 on the way up from 2010.
Downside motion below the failed retest of 2010, or at the exhaustion formation that might show up at 2027 – momentum will be key as well as market structure as it relates to the trending waves. Retracement into lower levels from 2010 gives us the targets at 2007.75, 2004.75, 2001.5, 1998.75, 1997, and perhaps 1992.75. If we lose these lower levels, S&P 500 futures could see 1982.25, and even 1970.75 – but I suspect that’s not likely this week.
Below is a video explaining key support and resistance levels on S&P 500 futures:
If you’re interested in the live trading room, it is now primarily futures content, though we do track heavily traded stocks and their likely daily trajectories as well – we begin at 9am with a morning report and likely chart movements along with trade setups for the day.
You can visit The Trading Vault to learn how to trade the way I do.
As long as the trader keeps himself aware of support and resistance levels, risk can be very adequately managed to play in either direction as bottom picking remains a behavior pattern that is developing with value buyers and speculative traders. Thanks for reading.
Twitter: @AnneMarieTrades
The author trades futures every day and may have a position in mentioned securities at the time of publication. Any opinions expressed herein are solely those of the author, and do not in any way represent the views or opinions of any other person or entity.


