All that bullish movement evaporated with Thursday and Friday’s selling in the S&P 500 futures (ES_F). We are now bouncing off another important support level that was broken. Resistance sits near 2013.75.
To be bullish right now, we’ll need to see the breach and positive retest of this level. Holiday environments will mean lighter volumes. Charts could still see a rally of buyers to the rescue but lower highs seem much more likely as sellers will try to take advantage of the momentum that sits in their favor at this time. Your trades should have short cycles.
Short term support on S&P 500 futures is now near the 2004.75 mark; and resistance near 2013.75. Momentum readings are negative and flattening– that means resistance should hold – and a lower high is likely. We should look for higher lows and higher highs to signal the break in downside momentum and a return to upward motion in smaller wave patters – consider the one hour chart for this and make sure you watch resistance. If the wave structure shifts from its current lower low, lower high formation – we will stop the decline and hold support. So far, roads still point south. To me, the decision zone sits near, the retest of 2004 – if it holds, we’ll have a shot at reversing the fall downward.
Short time frame momentum indicators are negative and flattening, and higher than Friday. Longer cycles are downward trending, and slipping into negative territory.
See today’s economic calendar with a rundown of releases.
RANGE OF TUESDAY’S MOTION
Crude Oil Futures (CL_F)
Moving average squeeze resolved downward for oil, and we now sit at important support near 35.5. I see support levels between 35.5 and 35.12. Though I still anticipate further downside, I see very jagged price action continuing as I have mentioned, so we could still pop sharply before reversing. Just follow your moving averages on tight time frames – keep it simple and pay attention to resistance levels for entry points short into support. If support begins to rise, well, you know you’ve got upside pending.
Short term support sits at 35.12. Resistance lies near 36.4, then 36.8, if that is breached and holds. For an intraday trading formation, we see a range event between 35.5 and 36.03, noting that momentum and trend are both neutral to bearish, and falling in shorter time frames. Breach above a 36.03 sends us to congestion near 36.2-36.4. If we hold that, the move sends us to 36.6-36.8, then 37.14 and perhaps 37.7. Charts are very muddy and congested. Below a 35.5 failed retest sends us to 35.35, 35.15, 34.8 and perhaps 34.5. Momentum on intermediate time frames is mixed and falling.
E-mini S&P 500 Futures (ES_F)
This week’s chart remains the same – heres the active S&P 500 futures support and resistance trading levels. Click to enlarge.
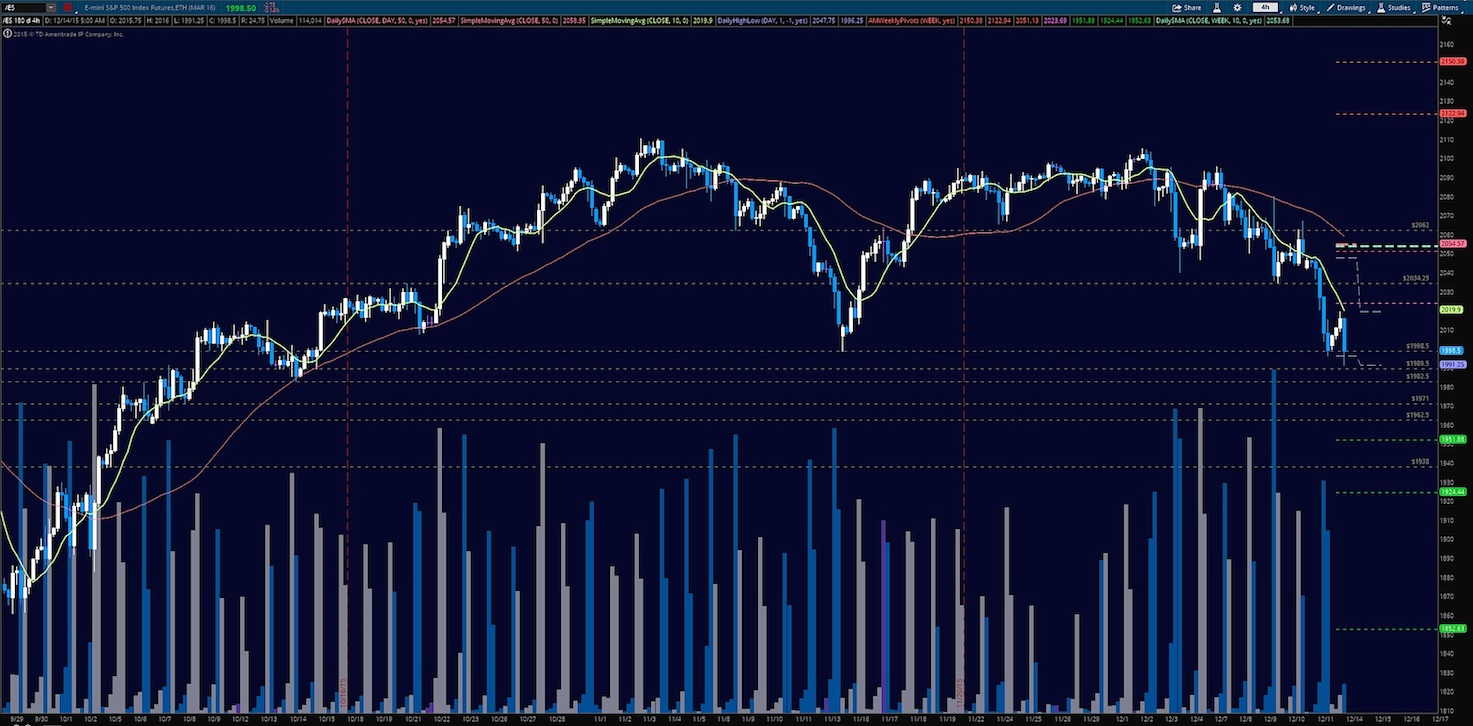
Upside motion is best setup on the bounce off the 2004.75 recovery – or a breach and positive retest of 2012. The long would be countertrend here but it appears we are attempting a bounce. A breach and retest that holds off 2004.75 makes a reasonable setup but watch 2011 for sellers to advance their agenda. The breach of 2014 will likely bring excited buyers in but again, watch momentum carefully here. If momentum holds, we could see 2015.75, 2021, 2027.25, and 2030.5.
Downside motion below the failed retest of 2004, or at the exhaustion formation that might show up at 2011, 2015, or 2021 – momentum will be key as well as market structure as it relates to the trending waves. Retracement into lower levels from 2015.5 gives us the targets at 2011.75, 2009.25, 2004.75, 2001.5, 1998.75, and perhaps 1992.75. If we lose these lower levels the charts could see 1982.25, and even 1970.75 – but I suspect that’s not entirely likely here today.
If you’re interested in the live trading room, it is now primarily futures content, though we do track heavily traded stocks and their likely daily trajectories as well – we begin at 9am with a morning report and likely chart movements along with trade setups for the day.
As long as the trader keeps himself aware of support and resistance levels, risk can be very adequately managed to play in either direction as bottom picking remains a behavior pattern that is developing with value buyers and speculative traders.
Twitter: @AnneMarieTrades
The author trades futures every day and may have a position in mentioned securities at the time of publication. Any opinions expressed herein are solely those of the author, and do not in any way represent the views or opinions of any other person or entity.


