Lots of charts looked ready to bounce last night at review and sure enough the S&P 500 futures rally went into effect overnight. I expect many stocks to gap, but with mixed momentum, the gaps should eventually fill.
I’ll be watching market forms to see what is most likely. The 1982 area I mentioned yesterday provided a fair region (the bounce was at 1983.25) for the big bounce we see to begin. Pullbacks should be bought as long as S&P 500 futures support at 2009 holds. That level may be the key to the S&P 500 futures rally.
Short term futures support is now near the 2010 mark; and resistance near 2036.5. Momentum readings are positive and lifting but with some divergence intraday – that means we watch for bounces to fail into higher lows, and lows to bring buyers at support. Interim bounce pattern shows at 2015.75. If the chart fails to bounce and recapture 2022, lower highs and lower lows will return to the pattern of the drift to deeper support.
Short time frame momentum indicators are positive and rising, and higher than Monday. Longer cycles are downward trending, and slipping into negative territory.
See today’s economic calendar with a rundown of releases.
RANGE OF TUESDAY’S MOTION
Crude Oil (CL_F)
Oil bounced hard off the 34.5 region – and the bounce continues. We should fail but the charts are showing the chance of a higher low. Support still sits at 34.5, while resistance lies near 37.25. For an intraday trading formation, we see a range event between 36.1 and 36.7, noting that momentum and trend are both bullish, and holding. Breach above 36.7 retest sends us near 36.87, then 37.1 and perhaps 37.48. Below a 36.03 retest sends us to 35.8, 35.57 and perhaps 35.15. Momentum on short time frames is negative and falling. See premium blog for tighter levels.
E-mini S&P 500 Futures (ES_F)
This week’s chart with active S&P 500 futures support and resistance trading levels. Click to enlarge.
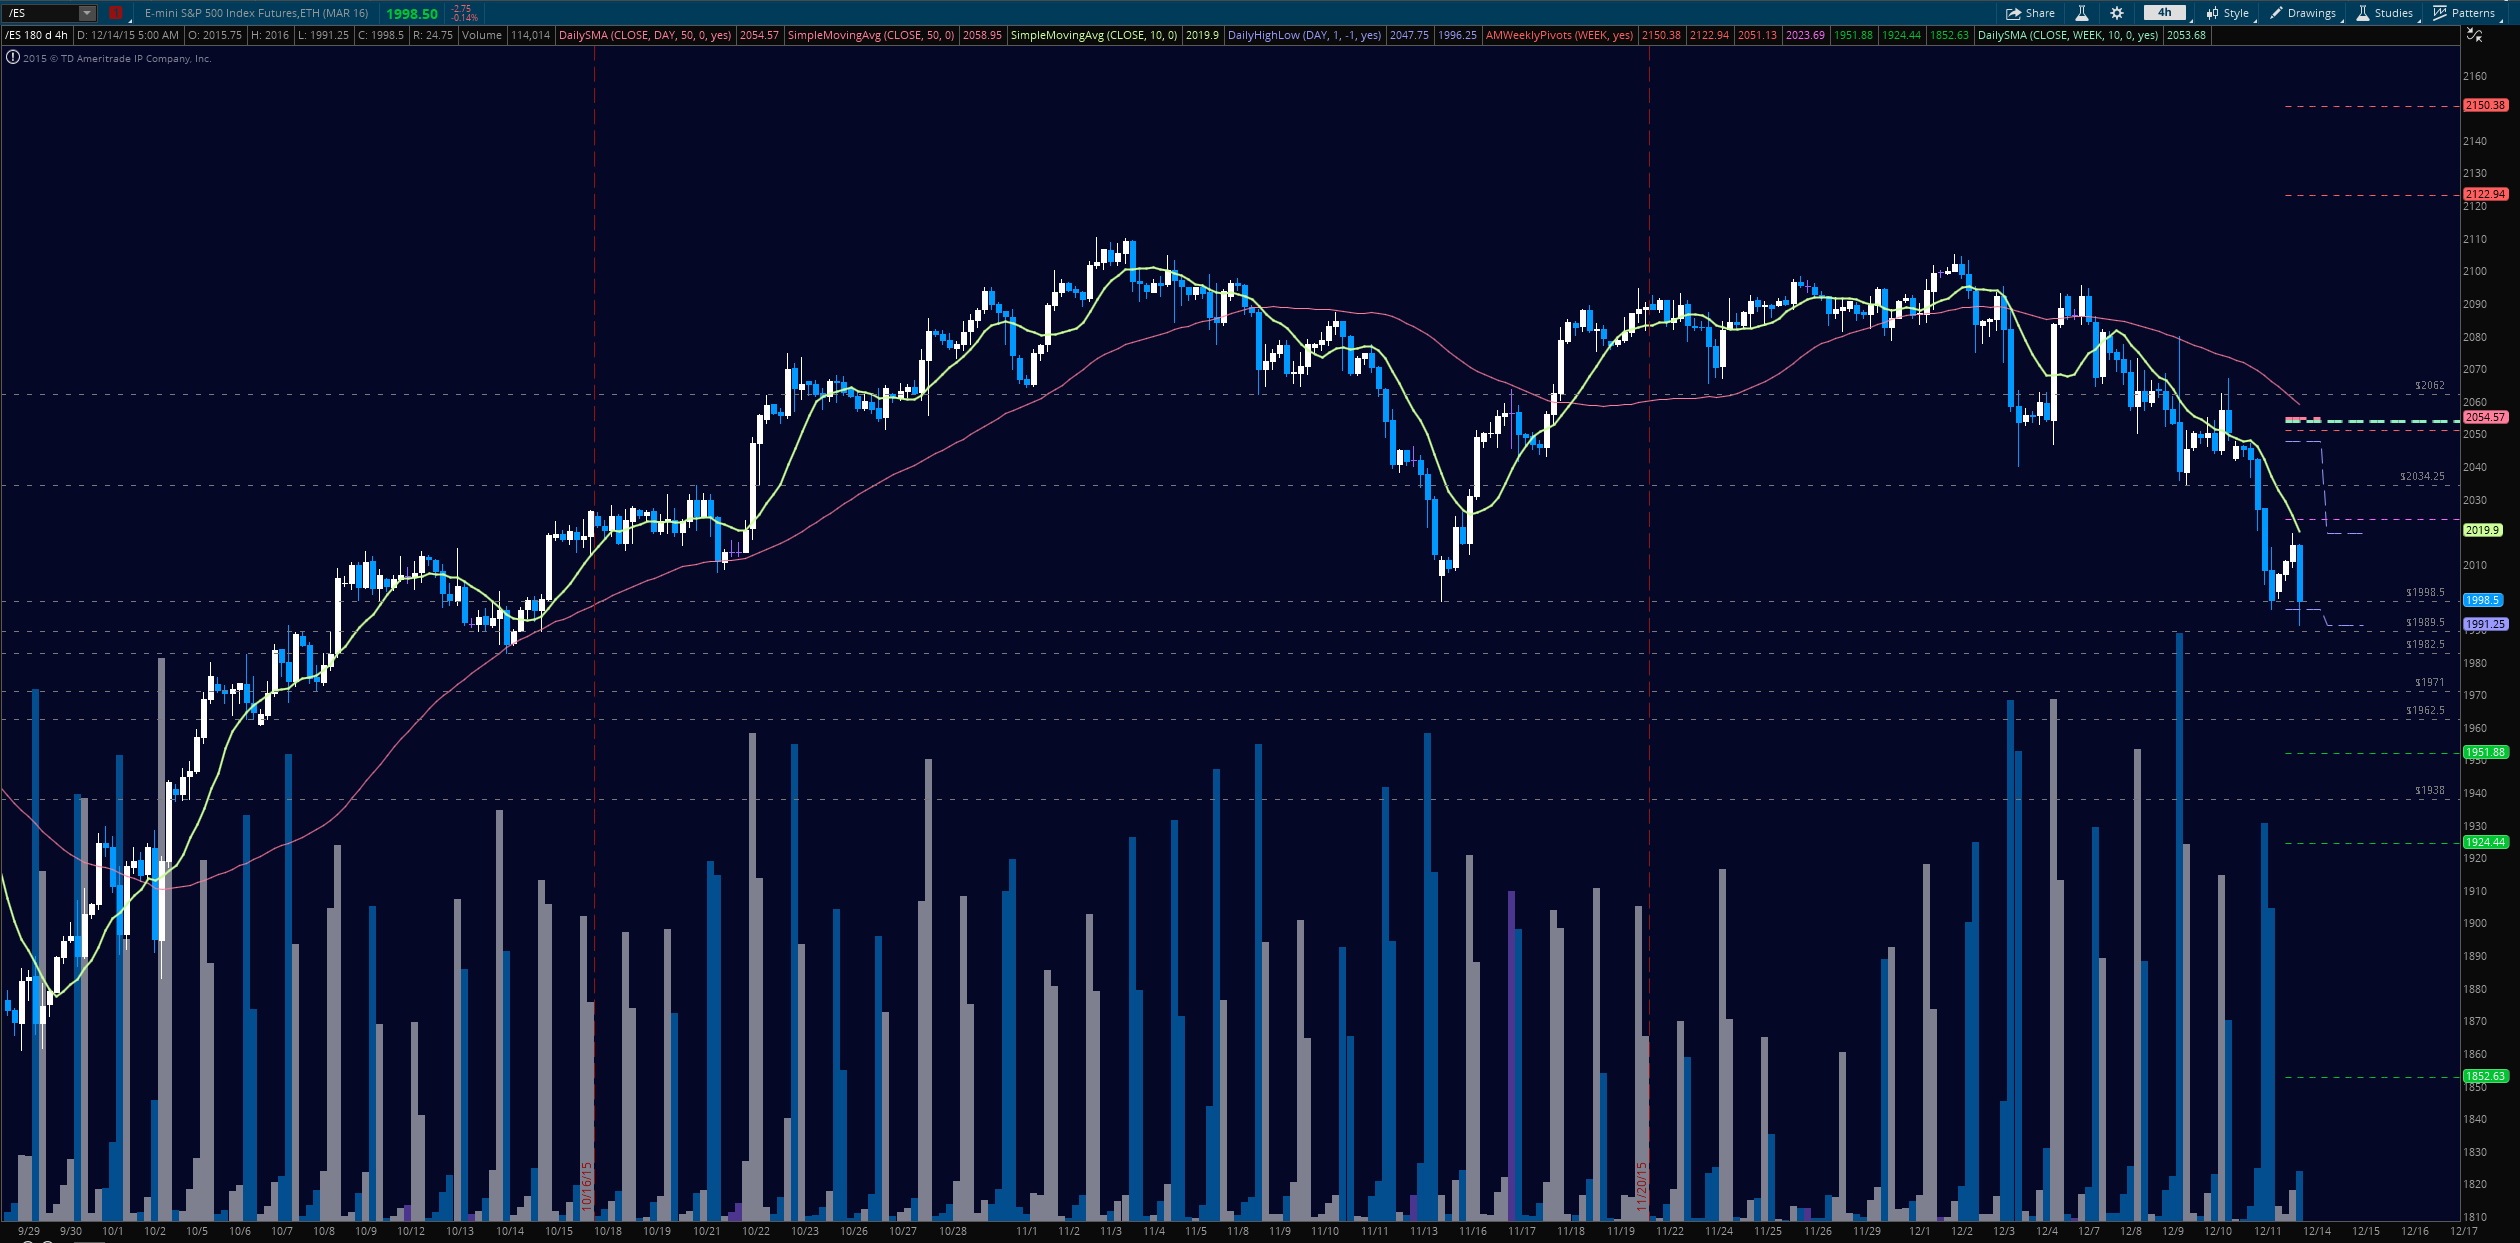
Upside motion is best setup on the bounce off the recapture of 2019, or a retest of 2015.75 after a bounce. That is the best case scenario for an S&P 500 futures rally.
A hold of 2015.75 should deliver 2017.75, 2021.25, then 2023.5, 2027.5, and perhaps 2034.25.
Downside motion below the failed retest of 2021, or at the failure to hold 2027 with negative momentum showing opens a short. Retracement into lower levels from 2021 gives us the targets at 2017.75, 2015.75, 2012.5, 2009.75, 2004.75, and 1998.75.
As long as the trader keeps himself aware of support and resistance levels, risk can be very adequately managed to play in either direction as bottom picking remains a behavior pattern that is developing with value buyers and speculative traders.
Visit ‘The Trading Vault’ to learn how to trade the way I do. Thanks for reading.
Twitter: @AnneMarieTrades
The author trades futures every day and may have a position in mentioned securities at the time of publication. Any opinions expressed herein are solely those of the author, and do not in any way represent the views or opinions of any other person or entity.


