This article looks at a unique indicator for global equities that captures quite a different kind of market breadth: market valuation breadth. The main takeaway is that it has moved into the danger zone.
The chart appeared in the latest edition of the Weekly Macro Themes report and points to an elevated risk of a pause or a pullback for global equities.
The indicator counts the number of countries with forward PE ratios trading above their longer term average. This is a loose proxy for saying how many countries are “expensive” (trading above their long term average) vs “cheap”. This is pitted against the MSCI All World Index. Note the ETF version of the All-World is ACWI (NASDAQ:ACWI).
Global Valuation Breadth Indicator – Is A Correction Nearing?
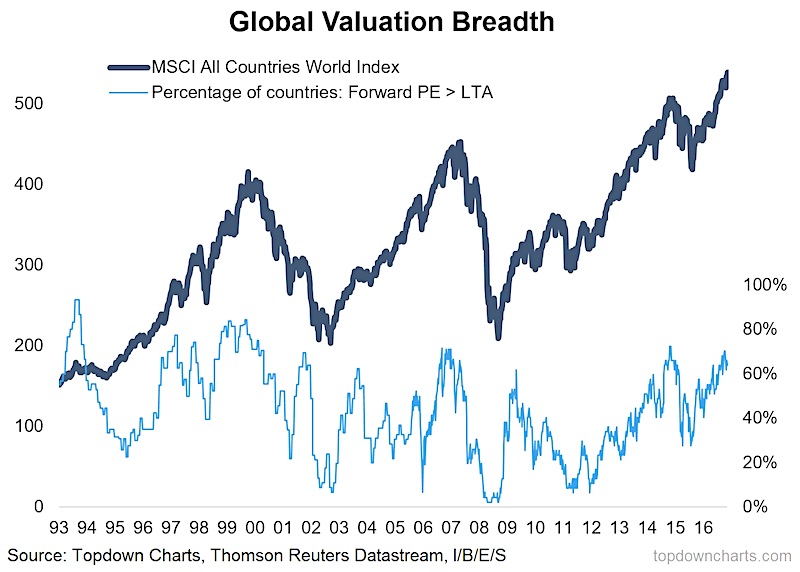
Given it is a breadth measure it tells you what proportion of countries are seeing more expensive forward PE ratios – similar to the traditional moving average breadth indicators.
In the past whenever this indicator has spiked higher it has usually coincided with a short-term pause or correction – and in some cases has flagged the start of a bear market.
ALSO READ: Is A Bubble Brewing In Income Assets?
So at this point you would have to say the risk of a pause or a pullback is elevated, based on this indicator alone.
Given the rest of our indicators, such as those focused on earnings and the economic cycle are still looking good, at this stage we would consider this to be more of a correction risk rather than a bear market risk. Were the economic indicators to start materially deteriorating it would be a different story.
So remember, while history doesn’t necessarily repeat, as the chart shows, it often rhymes.
Twitter: @Callum_Thomas
Any opinions expressed herein are solely those of the author, and do not in any way represent the views or opinions of any other person or entity.


