After the Fed meeting, we thought it would be useful to see the July calendar ranges and give you a brief lesson in how to use them.
Who is this for?
The price levels defined by this trading method have proven to be insightful in all markets.
Longer-term investors can use this to identify longer-term trend inflection points.
Active investors can use the price levels identified by the July Range as entry points for trades that can last days, weeks, or months.
Focusing on the July Calendar Range Breakout only:
• The “Close & Continue” Breakout Pattern
1. “Close” outside the range
2. “Continue:” Trade beyond the range of the breakout day
• With an intra-day 30-min Opening Range breakout
• Stop levels
• Close back in the range
• Move below (above) the range of the day that broke out
• Close & continue beyond the opposite range level
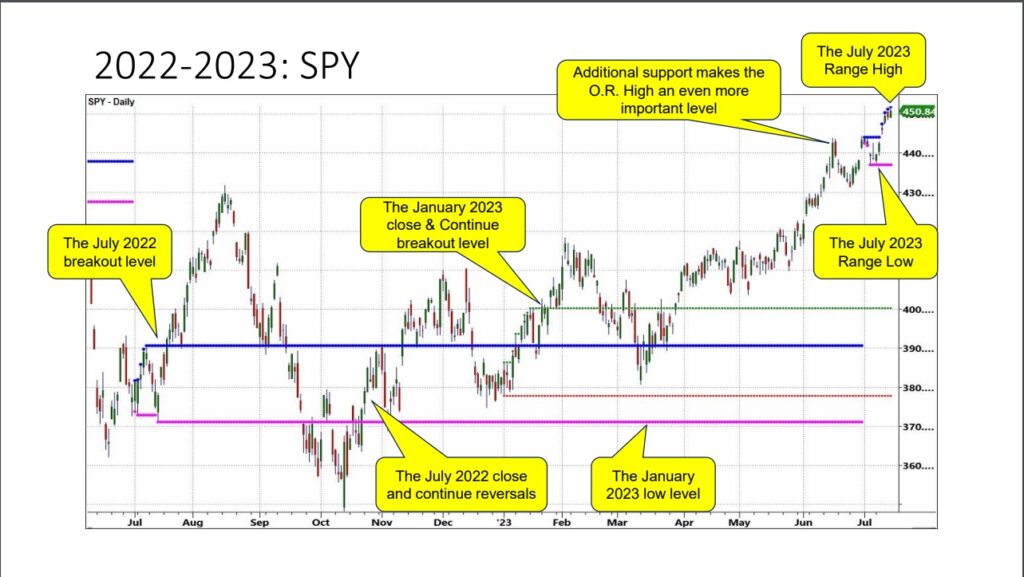
Looking at the SPY chart, we have had 7 trading days above the range high.
However, to date, SPY has not really taken off from that level and sits more in consolidation mode.
451.93 is the green line or 6-month calendar range high.
Should it hold, we would maintain a positive bias.
Should it fail, we would most likely exit any long SPY position.
And, should it continue to fail below the range high, we would consider that a potential short and perhaps top for the market-until such time-the price comes back above that level.
At that point, the July 6-month calendar range low at 437.06 comes into focus.
Pay attention to the 6-month January 2023 calendar range as well as the July 2022 6-month calendar range.
Most types of investors had lots of trading opportunities around these lines in the sand.
See more:
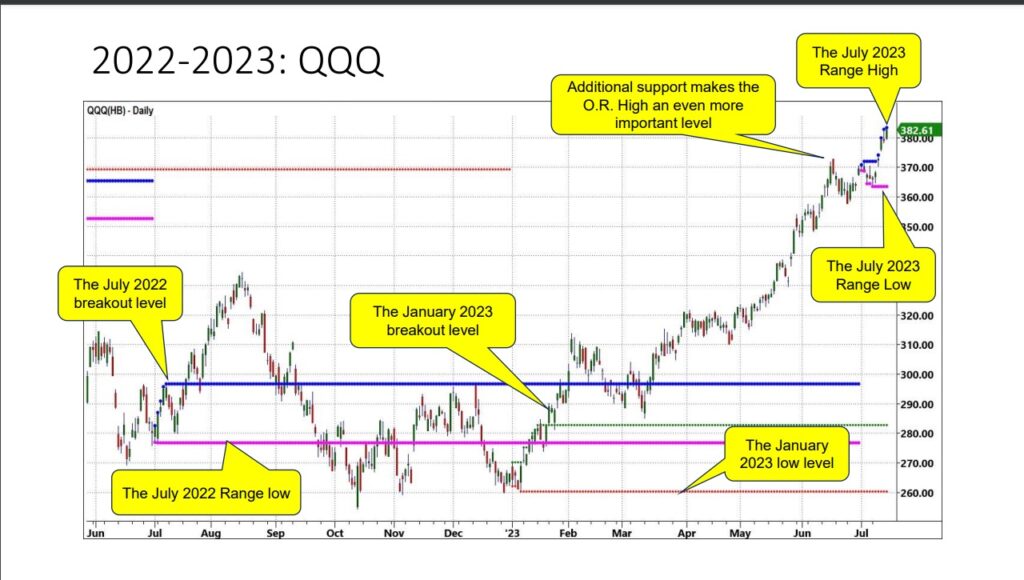
NASDAQ is already below its July 6-month calendar range. We are now watching the low at 363.41 as the next point.
A break below would tell us the uptrend for now, is over.
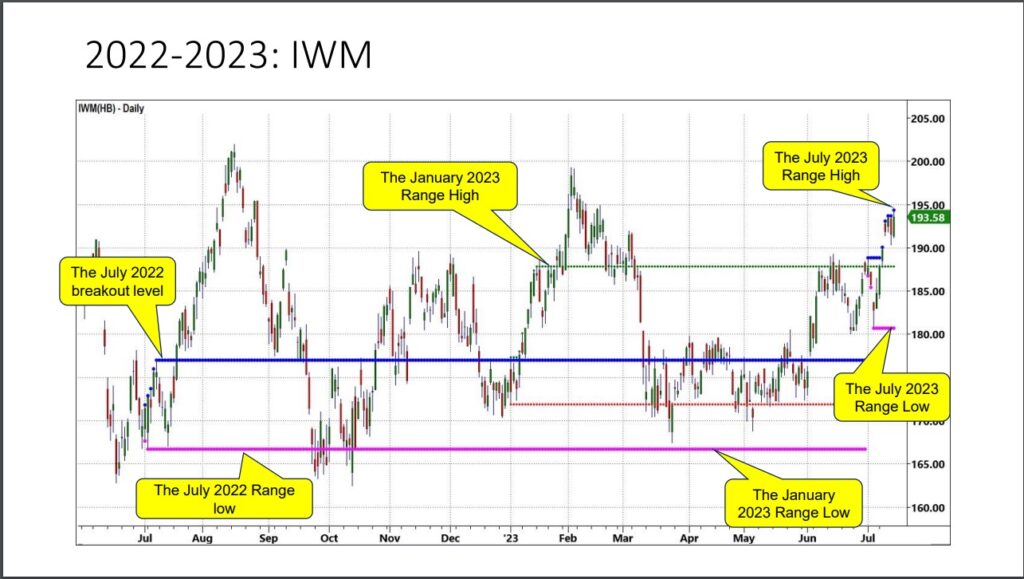
The Russell 2000 looks similar to the SPY chart. Currently trading above the 6-month range, the bias is positive unless the July range high breaks. Notice the distance between the July 6-month range high and low.
That tells us that even with a break below, we have substantial room to fall without breaking the overall uptrend. This is unique to IWM-our main index focus for the 2nd half of 2023.
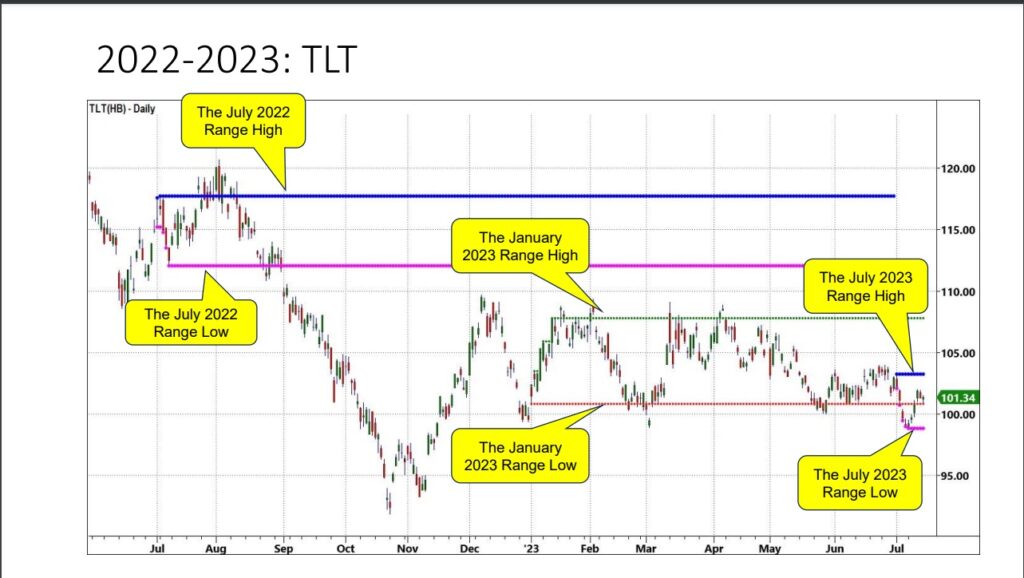
The most interesting chart for us is the long bonds or TLT chart.
The “higher for longer” folks want to see TLT break under the July range low or 98.85.
The “last rate hike before a pause and a pivot” crowd, will want to see TLT clear above the July range high or 103.26.
Note that once TLT failed the January 6-month calendar range high, it tested and held the 6-month calendar range low.
Now, with a new range, hopefully the next direction for bonds and rates will become clearer.
This daily is an abbreviation of MarketGauge’s 6-Month Calendar Range strategy setup and indicators.
This strategy, tactics used to trade it, and market scans used to identify trading opportunities are covered in our ‘Complete Trader’ and ‘Mish’s Training’ programs.
If you’d like to take this to the next level with more detailed instruction, the indicators, additional trade ideas, and live mentoring…
Click here to learn more about Calendar Ranges.
Twitter: @marketminute
The author may have a position in mentioned securities at the time of publication. Any opinions expressed herein are solely those of the author and do not represent the views or opinions of any other person or entity.


 Ready To Break Out?")

