The financial sector is the focal point of the global economy. So it’s no wonder that investors pay close attention to its performance within the stock market.
And this is especially true when recession fears rise due to lackluster economic growth.
Kinda sounds like today’s markets, eh?
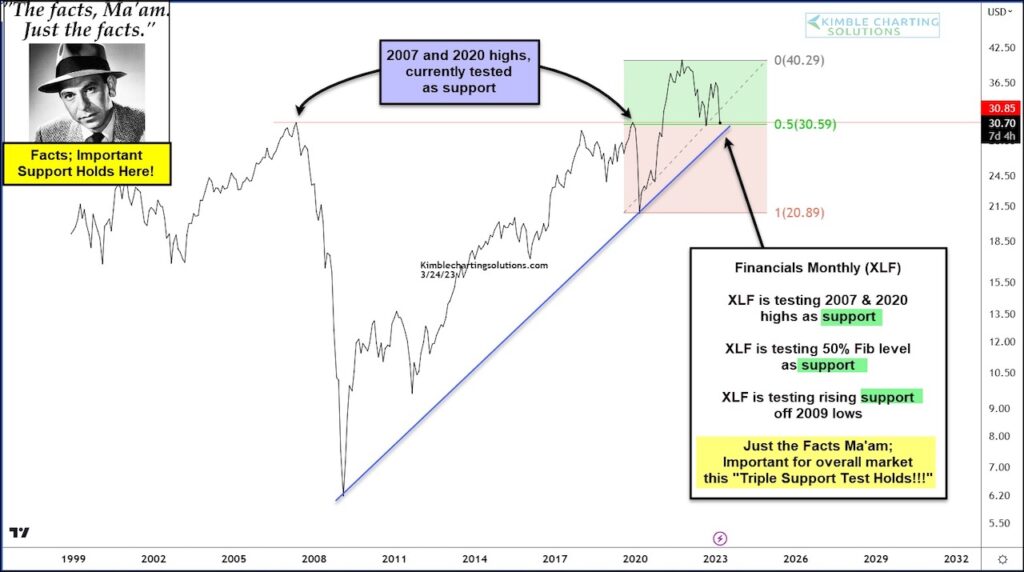
“The facts, Ma’am. Just the facts”
Is there trouble ahead for the economy? And for the stock market? Well, today’s “monthly” chart of the Financial Sector ETF (XLF) is at a make-or-break triple price support level. And what happens next should answer those questions.
To be clear, XLF is testing 2007 and 2020 highs, its 50% Fibonacci level, and its rising trend line support all at once. Seems like this is a historic moment for XLF in both time & price.
Investors will breath a sigh of relief it continues to hold above this triple support. However, if it breaks down below this support, the economy and stock market may take a turn for the worse. Stay tuned!
$XLF Financial Sector ETF “monthly” Chart
Note that KimbleCharting is offering a 2 week Free trial to See It Market readers. Just send me an email to services@kimblechartingsolutions.com for details to get set up.
Twitter: @KimbleCharting
Any opinions expressed herein are solely those of the author, and do not in any way represent the views or opinions of any other person or entity.


