“It’s self-defeating to use the wrong monetary policy.” -Ben Bernanke
- What is productivity?
- The Federal Reserve’s flawed growth benchmark
- Excessive monetary policy is crushing productivity
- The prescription for sustainable, durable growth – productivity
“Because it is unclear exactly why productivity growth has slowed recently, it is difficult to be confident about what it will do in the future”. –Bill Dudley June 2015
The recent quote from Federal Reserve Bank of New York President and Vice-chairman of the Federal Open Market Committee, Bill Dudley, inspired us to write this article and explain what Mr. Dudley cannot; why productivity, the key driver of economic growth, is not only slowing but on the verge of declining.
Bill Dudley and the Federal Reserve (Fed), in their efforts to influence economic growth may have created a speculative and consumption driven environment that is crushing productivity growth. This article explains what productivity is, how productivity has suffered at the hands of poorly benchmarked Fed policies and why those in charge of monetary policy must change their views if America is to economically thrive once again.
Productivity
Productivity is a core economic concept which measures the amount of leverage an economy can generate from its 2 primary inputs, labor and capital. Without productivity, economic growth is purely reliant on the 2 inputs. Given the limited nature of both labor and capital, they cannot be depended upon to produce durable economic growth over long periods of time. Leveraging labor and capital, or becoming more productive, is a function of many factors including innovation, education and financial incentives. In “Innovation – Too much, or too little of a good thing?” we discussed why the plethora of new technologies in the marketplace, are not as productive, especially in the long term, as they may appear. True ground breaking innovation involves time, effort and significant capital and ingenuity. Therefore it is imperative to ask, as we do in this article, is the Fed doing their part and providing pro-innovation incentives?
Labor
Labor, or human capital, is largely a function of the demographic makeup of an economy and its employees’ skillset and knowledge base. In the short run, increasing labor productivity is difficult. Changes to skills training and education take time to enact and produce a meaningful effect. Similarly, changes in birth rate patterns require decades to influence an economy. Immigration policies are arguably much easier to amend to foster more immediate growth, but the likelihood of pro-immigration policies these days is not probable.
Within the labor force, the biggest trend affecting current and future economic activity is the so called “silver tsunami”, or the aging of the baby boomers. This cohort of the population, ages 51 to 69 are beginning to retire. As this occurs, they tend to consume less, rely more on financial support from the rest of the population, and withdraw valuable skills and knowledge from the workforce. The outsized number of people in this demographic cohort makes this occurrence more economically damaging than usual. As an example, the old age dependency ratio, which measures the ratio of people aged greater than 65 to the working population ages 18-64, is expected to nearly double by the year 2035 (Census Bureau).
While the implications of changes in demographics and the workforce composition are numerous, they only require one vital point of emphasis: the significant economic contributions attributable to the baby boomers from the last 30+ years will diminish from here forward. As they contribute less, they will also require a higher allotment of financial support, becoming more dependent on younger workers.
Capital
Capital includes natural, man-made and financial resources. Over the past 30+ years, the U.S. economy benefited from significant capital growth, in particular debt. The growth in debt outstanding, a big component of capital, is shown (black line) in the graph below. The increase is stark when compared to the relatively modest level of economic activity that accompanied it (green line). The red arrows highlight the exponential rise in the ratio of debt to economic growth.
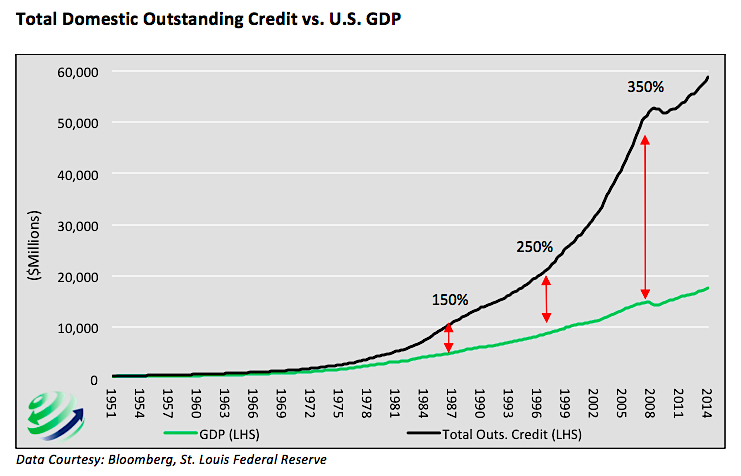
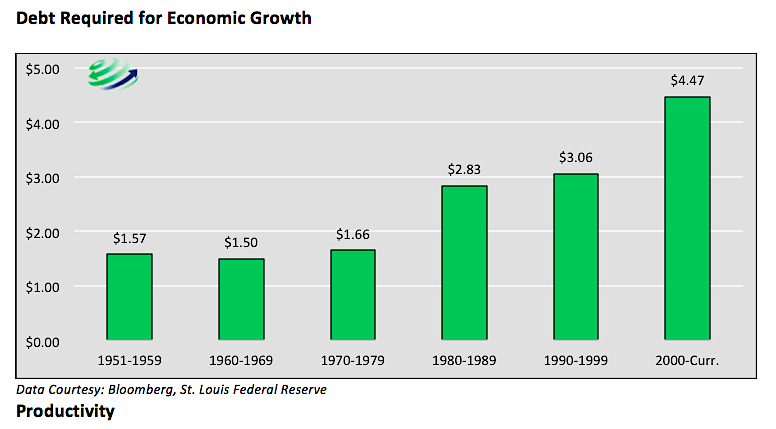
This divergence in debt and economic growth is a result of many consecutive years of borrowing funds for consumptive purposes and the misallocation of capital, both of which are largely unproductive endeavors. In hindsight we know these actions were unproductive as highlighted by the steadily rising debt to GDP ratio shown above. The graph below tells the same story in a different manner, plotting the amount of debt required to generate $1 of economic growth.
Productivity
Since 1980, the long term average growth rate of productivity has stagnated in a range of 0 to 2% annually, a sharp decline from the 30 years following WWII when productivity growth averaged 4%. The most recent productivity report from the San Francisco Federal Reserve shows an annualized decline of .06% versus the prior year. (https://www.frbsf.org/economic-research/indicators-data/total-factor-productivity-tfp/)
The graph below plots 10 year average productivity growth (black line) against the ratio of total U.S. credit outstanding to GDP (green line).
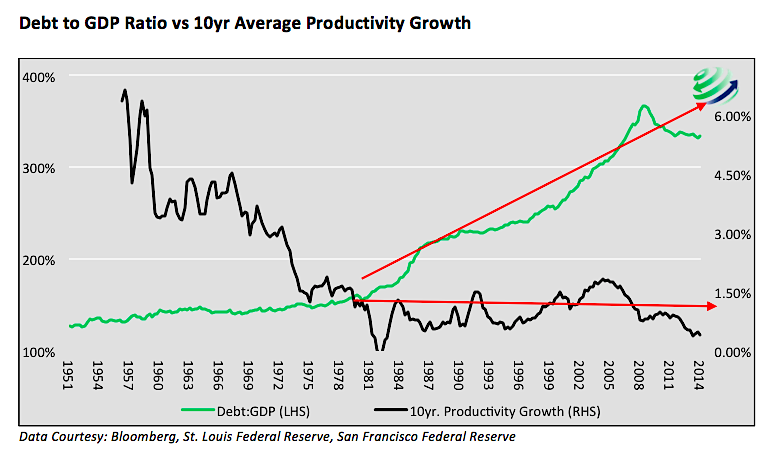
Within the graph, note the comparatively weak rate of productivity growth since 1980 and, more importantly, the trend towards zero productivity growth over the last 10 years. Additionally, productivity stagnation started as the debt to GDP ratio started climbing at a faster pace. This graph reinforces the message from the other debt related graphs – over the last 30 years the economy has relied more upon debt growth and less on productivity to generate economic activity.
Given the finite ability to service capital and aforementioned demographic challenges, future economic growth, if we are to have it, will need to be based largely on gains in productivity as reliance on debt and demographics has largely run its course.
The Fed’s Questionable Growth Target
Throughout the last 30 years the Fed has become increasingly proactive in incentivizing economic growth towards their target – the potential economic growth rate. Unfortunately, the Fed’s measure of potential growth rate may be flawed leading to harmful consequences.
To better explain potential growth we quote from an article entitled What Is Potential GDP and Why Does It Matter? Authored by William T. Gavin, Vice President and Economist at the St. Louis Federal Reserve. In the article, Mr. Gavin addresses how the Fed arrives at the potential growth rate as follows: “Instead, they estimate potential GDP by constructing measures of the trend in actual GDP that smooth out business cycle fluctuations”. This concept of relying on prior trends versus future potential is vital to grasp. From the same, article Mr. Gavin further explains: “But why does potential GDP matter? How do we use it? Potential GDP is important because monetary policymakers use the difference between actual and potential GDP—the output gap—to determine whether the economy needs more or less monetary stimulus”.
Said differently, the decisions on how to employ monetary policy are based on a comparison of historical and current economic growth. This method ignores potential changes in growth factors that may cause GDP to deviate from the past.
continue reading on the next page…

: Showing Some Signs of Emerging Strength")

