The following is a recap of The COT Report (Commitment Of Traders) released by the CFTC (Commodity Futures Trading Commission) looking at futures positions of non-commercial holdings as of May 26, 2015. Note that the change is week-over-week.
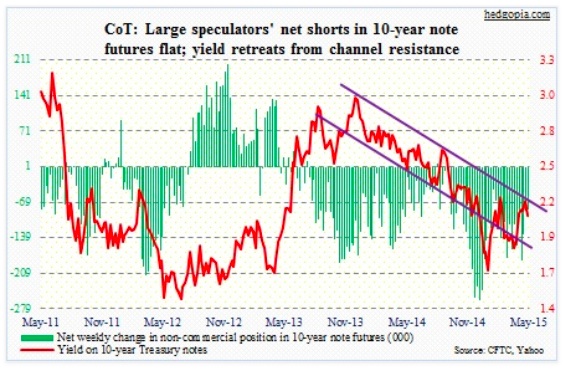
10-Year Treasury Note: If we just focus on what the consensus was expecting, U.S. economic data this week were split down the middle, with maybe a slight upward bias. Core capex, new-home sales as well as pending home sales were above expectations. Even the downward revision in 1Q15 real GDP was less than expected. In contrast, the ISM Chicago PMI and the University of Michigan’s consumer sentiment index were downright dismal.
In addition, Fed officials continued to jawbone the market saying/hinting a rate hike is coming later this year. The bond market would not give a damn. The 10-year yield fell 12 basis points for the week, with all four sessions in the red.
After a strong Friday last week, yields came down hard on Tuesday, losing the 200-day moving average. Daily momentum was already under pressure. If technicals prevail, yields have more to go on the downside. TraderWeekly momentum indicators have turned lower. After back-to-back dragonfly dojis the past two weeks, the iShares 20+ Year Treasury Bond Fund (TLT), rallied nearly two percent this week, and is back above 122.
Per the COT Report data, non-commercials have cut back net shorts from three weeks ago, but still hold sizable positions. If yields head back toward the lower end of the channel it is in – a likely scenario – these traders will come under pressure to reduce.
Currently net short 83.5k, down 2.3k.
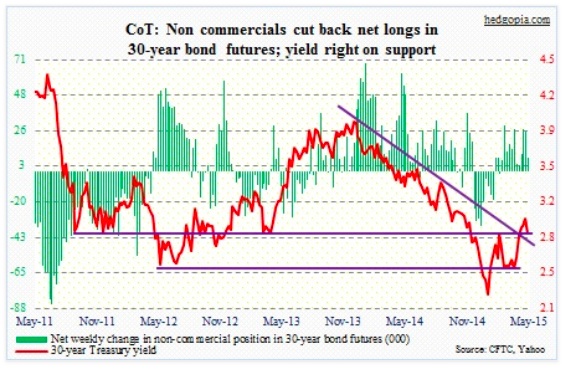
30-Year Treasury Note: Yields are sitting right on support, which also approximates the 200-day moving average. Next week, there are at least a couple of data points that matter – jobs report and ISM manufacturing.
The ISM report is on Monday. The index was unchanged in April at 51.5, and has seen quite a deceleration. Last August was 58.1. The new orders component rose to 53.5 in April from March’s 51.8 but remains way below 63.9 last August – serious deceleration in momentum. By the way, the ISM Chicago PMI fell to 46.2 in May from 53.1 in April. It sure looks like 1Q slump is extending into 2Q. In contrast, ISM non-manufacturing is holding up better. It will be out on Wednesday. New orders, for instance, were 59.2 in April, versus 62.6 last July.
Also on Monday, we get personal income for April. We will find out how core PCE performed in April. This is the Fed’s favorite measure of inflation, and continues to remain subdued. Month-over-month, it barely grew the past three months – 0.2 percent in January, and 0.3 percent each in February and March. Year-over-year, it has been stuck at 1.3 percent the past four months. The last time it grew at two percent was in April 2012.
Factory orders are out Tuesday. The durable-goods report for April was out this week. Non-defense capital goods ex-aircraft, a proxy for business capital expenditures, has risen for two consecutive months, and may get revised.
Thursday is productivity. 1Q numbers are already out, so this is a revised version. The trend is not going the right direction. Non-farm output per hour has been in the negative territory the past two quarters. Year-over-year, 1Q managed to grow 0.6 percent, following a negative 0.1-percent reading in 4Q.
Friday is the big one – the jobs report for May. We will learn whether or not March was an aberration. Non-farm payroll only grew 85,000 that month, following 12 consecutive months of 200,000-plus. But April was much better, at 223,000. Another area of focus is average hourly earnings. In recent months, earnings for all employees have been growing faster annually than for production and non-supervisory employees, meaning the supervisors are doing better than the supervised.
Currently net long 8.5k, down 16.4k.
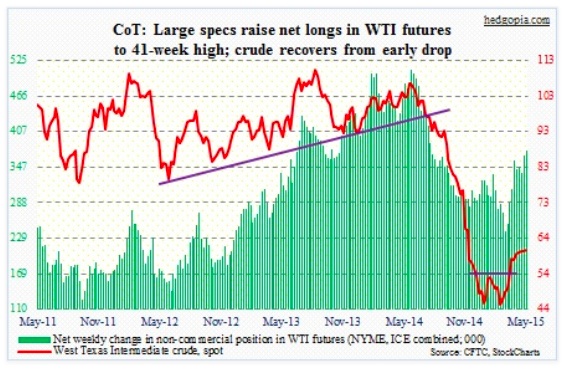
Crude Oil: The week produced a mismatch of good and bad news. There were wildfires in Alberta. Rigs fell by another 16, to 646 – the lowest level since 2010. Crude inventories are still high, but have been falling. Inventories fell by 2.8 million barrels last week – fourth straight week of decline. Gasoline demand has improved. Healthy margins have resulted in strong refinery demand for crude. This has prompted refiners to postpone maintenance. Here is the thing. The gasoline that is being produced today will not be used beyond September 15. Plus, the refineries will need maintenance. The second half will be interesting.
The bigger issue is the June 5th OPEC meeting. The way it is looking now, the cartel will maintain the status quo – no cut in its 30-million-barrels-a-day quota. The public is probably beginning to realize this. They have been pulling out money in recent weeks. This month, nearly $500 million left USO, the United States Oil Fund, and another $300 million exited XLE, the energy SPDRs.
If you thought all this would combine to put pressure on the WTI, you are half right. Until Thursday, the crude was down three-plus percent for the week, having come on the heels of three weekly dojis. Come Friday, it rallied nearly four percent. The 58 level was defended – again.
Non-commercials, who have been adding to net longs for two months now, are being vindicated. For now. Near-term, WTI conditions are oversold. Not so intermediate-term.
Currently net long 375.7k, up 9k.
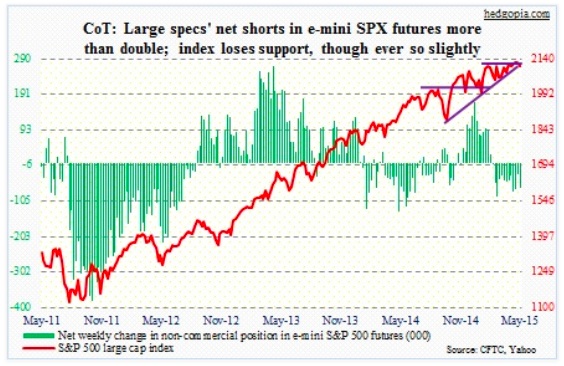
E-mini S&P 500: The index has been range-bound for so long a break either way has the potential to be explosive. Bulls have so far been unable to build on the recent breakout. In fact, the Tuesday selloff has now pushed the index below both the breakout point and the October 2014 trendline. It does not look good at least near-term.
Transports have been acting poor for a while now. This is a clear negative. In contrast, financials, regionals in particular, act fine. No clean signal here. Transports have broken down, diverging from industrials. For the Dow sell signal to trigger, the Dow Industrials need to break 17600. The Dow Jones Transportation Average has already lost 8550.
One tidbit: Morningstar found four fund managers who reduced their own stakes in the funds they managed. Not a confidence-booster as far as the average Joe or Jane is concerned, come to think of it.
So what’s the COT Report saying? After having cut back net shorts by more than half last week, non-commercials more than doubled this week.
Currently net short 69.2k, up 38.2k.
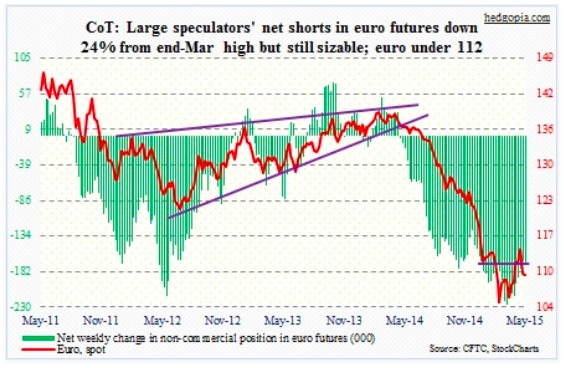
Euro: As far as traders were concerned, the Spain elections were a huge attention-grabber as the ruling People’s Party suffered its worst results in 24 years, even as the anti-austerity Podemos excelled. Greece continues to grab the headlines. One second it looks like the Greek saga is nothing but a noise, and the next second it feels like what is transpiring there is worth paying attention to.
The euro was like a ping pong ball this week – back and forth, back and forth. In the end, the currency marked time, essentially unchanged. Next week, the ECB meets Wednesday. As a reminder, the euro is back below crucial 112. Room to rally? Yes, if daily wins out over weekly; conditions are oversold for the former and overbought for the latter.
Currently net short 171.7k, up 3.4k.
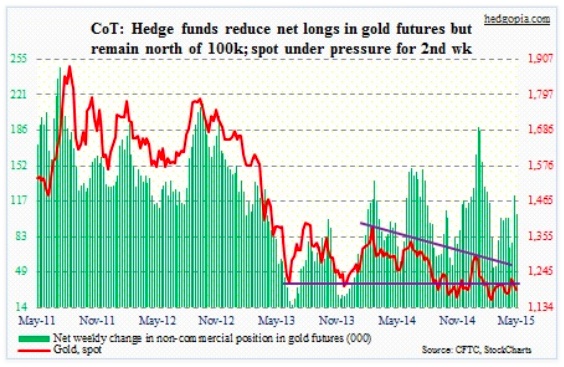
Gold: A sign of the times perhaps! Next month, Direxion Investments, a provider of leveraged index funds, plans to shut down the Daily Gold Bull 3x Shares ETF (BAR), because of lack of demand. NUGT and DUST, the ETFs targeting miners, are left intact.
Gold has once again fallen back below 1,200, but buyers did show up near 1,180. Looks good near-term.
Currently net long 104.7k, down 17.9k.
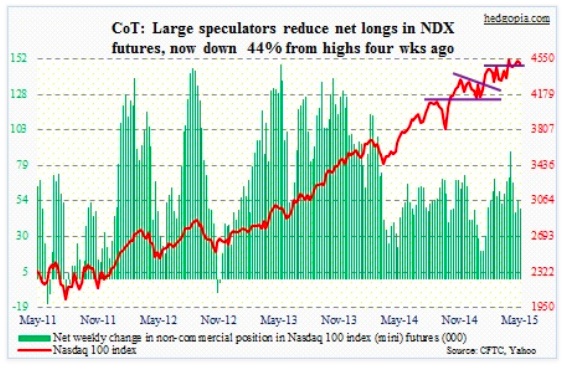
Nasdaq 100 index (mini): Earlier in the week, Credit Suisse reminded us that in the just-concluded earnings season about half of all semi companies provided light forecasts.
Even the high-growth semi companies are not immune to the prevailing phenomenon of lack of growth on the top line. Enter M&A. Companies are having to (1) buy growth and (2) scale up. Explains why AVGO and BRCM needed each other. Having said that, the sudden burst of enthusiasm around semi stocks only makes sense if you are a trader, as it is centered around M&A hope, not business fundamentals. But it is what it is.
SMH, the Market Vectors semi ETF, broke out this week, but has the potential to be a great short down the road. Speaking of which, the Nasdaq composite tested its March 2000 high this week. What’s it going to be? A breakout or a double top? Bulls have expended a lot of energy getting the index this far. Margin debt shot up to another high – $507.2 billion in April. These things are always fun during an accumulation phase. Not so when momentum reverses.
For now, let us see if bulls can defend 4480 on the NDX. Per the COT Report data, non-commercials continue to reduce net longs, now down 44 percent from a month ago.
Currently net long 49.2k, down 5.9k.
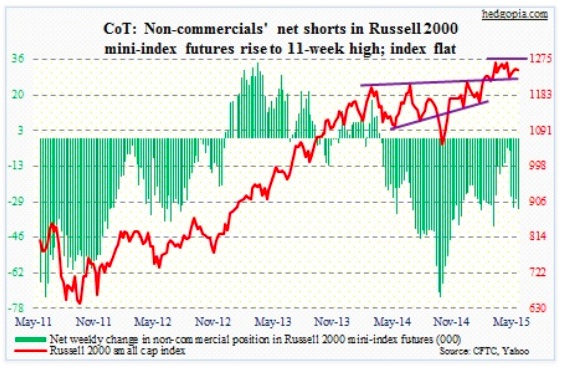
Russell 2000 mini-index: Small-caps continue to fare better than large-caps – relatively, that is. But it just does not feel like there is a whole lot of conviction behind this outperformance. The index is still below its mid-April high. COT Report data shows that non-commercials are sticking with their net shorts – now at an 11-week high. The 1215 support is only 2.5 percent away, and likely comes into play sooner than later.
Currently net short 32.6k, up 4.6k.
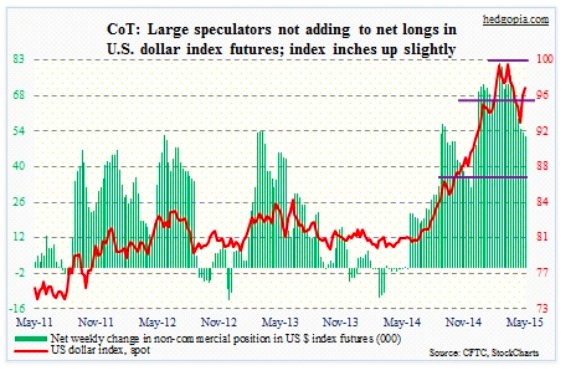
U.S. Dollar Index: James Bullard, president of St. Louis Fed, told Bloomberg Radio Thursday that he would like to move this year. This is an about-face for someone who in the midst of an equity selloff on October 16th told Bloomberg TV that the Fed should consider delay in ending QE, also hinting that QE4 was possible. This is just one example of several jaw-boning attempts by Fed officials recently.
Dollar-tracking ETFs have been attracting funds in recent weeks. These investors better hope data begins to cooperate – ISM and the jobs report in particular this week.
From the middle of May in two weeks, the dollar index rallied five percent. Non-commercials were not impressed. They continued to cut back net longs.
Currently net long 52.3k, down 1.2k.
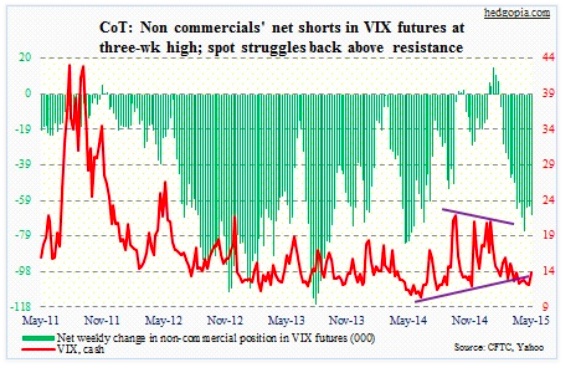
VIX: In a week in which the spot VIX managed to close above trendline resistance, non-commercials further added to net shorts. And by doing that, they are once again at odds with their peers who doubled net shorts in e-mini S&P 500 futures. They cannot both be right.
June calls continue to be in demand. As well, prices for shorter-term futures rallied more this week – like June rallying more than July. People are seeking protection.
Currently net short 67k, up 4.6k.
Thanks for reading.
Twitter: @hedgopia
Read more from Paban on his blog.
No position in any of the mentioned securities at the time of publication. Any opinions expressed herein are solely those of the author, and do not in any way represent the views or opinions of any other person or entity.

: Cup (and Maybe Handle) Watch")
 Reaches Important Price Support")

