The following are charts and data showing non-commercial futures trading positions as of October 3, 2017.
This data was released with the October 6 Commitment of Traders Report (CoT). Note that these charts also appeared on my blog.
The 4 charts below look at non-commercial futures trading positions for the S&P 500, Crude Oil, Gold, and the US Dollar. For the week, the S&P 500 Index (INDEXSP:.INX) was up +1.2%, the Gold ETF (NYSEARCA:GLD) was down -0.4%, and the Crude Oil ETF (NYSEARCA:USO) was down -4.4%.
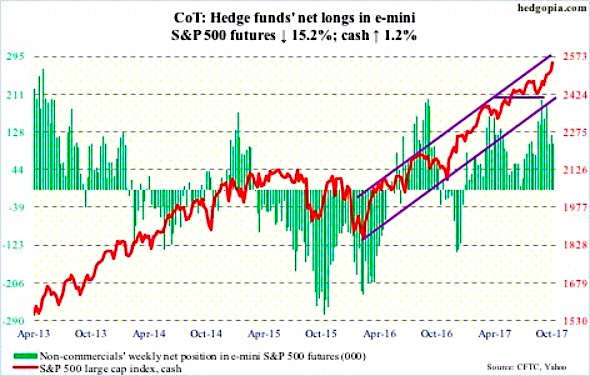
E-mini S&P 500: Currently net long 101.5k, down 18.2k.
For six consecutive sessions through Thursday, the cash opened just about flat, and then progressively drew in buyers as the session progressed, closing at/near session high. Such has been the momentum. The latest rally began after the S&P 500 broke last Friday out of short-term resistance at 2509.
In the week to Wednesday, flows were not in cooperation. SPDR S&P 500 ETF (NYSEARCA:SPY) lost $1.9 billion. The loss was more than what VOO (Vanguard S&P 500 ETF) and IVV (iShares core S&P 500 ETF) took in – $427 million and $1 billion, respectively (data sourced to ETF.com).
In the same week, U.S.-based equity funds lost $1 billion (courtesy of Lipper).
This did not stop the bulls from rallying the stock market index another 1.2 percent this week.
The S&P 500 is overbought on nearly all time frame, with the daily RSI (14-day) in particular closing the week at 76-plus. It read 78-plus on Thursday – the highest since February this year.
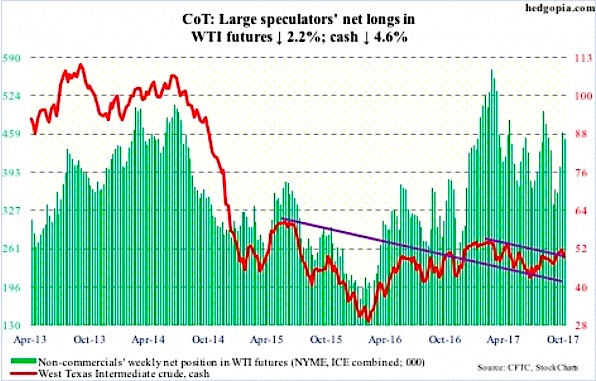
CRUDE OIL: Currently net long 451.1k, down 10.2k.
Spot West Texas Intermediate crude oil ($49.29/barrel) sits at a crucial juncture.
It came under pressure after getting rejected at the daily upper Bollinger band on Thursday last week. This Friday, the 200-day was lost, and the 50-day was tagged. The latter also represents a breakout retest of a trend line from February this year. Right around there lies a rising trend line from June this year – and a must-hold for the bulls.
Medium term, the weekly chart has tons of room to continue lower.
The EIA report for the week of September 29 – out Wednesday – showed crude oil stocks dropped six million barrels to 465 million barrels. As did distillate stocks – down 2.6 million barrels to 135.4 million barrels.
Crude oil imports fell, too – by 213,000 barrels/day to 7.21 million b/d.
Gasoline stocks, however, rose 1.6 million barrels to 218.9 million barrels.
Crude oil production continued to rise – up 14,000 b/d to 9.56 mb/d. This was a 26-month high.
Refinery utilization declined five-tenths of a point to 88.1 percent. Post-Harvey, it dropped to 77.7 percent three weeks ago.
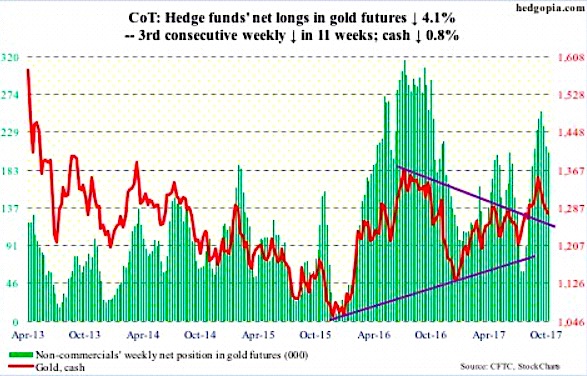
GOLD: Currently net long 203.9k, down 8.7k.
From gold bugs’ perspective, the week produced both good and bad news. Good because buyers showed up at the $1,270/ounce level on the cash ($1,274.9). Bad because this was not enough to arrest the downward momentum.
In the week through Wednesday, GLD (SPDR gold ETF) lost $425 million, even as IAU (iShares gold trust) took in $124 million (courtesy of ETF.com).
The weekly chart continues to unwind the overbought condition it is in.
In a worse-case scenario, the price of Gold drops to test the 200-day ($1,250.91). This is about where the trend line from last December meets.
That said, the daily price chart for gold is itching to move higher.
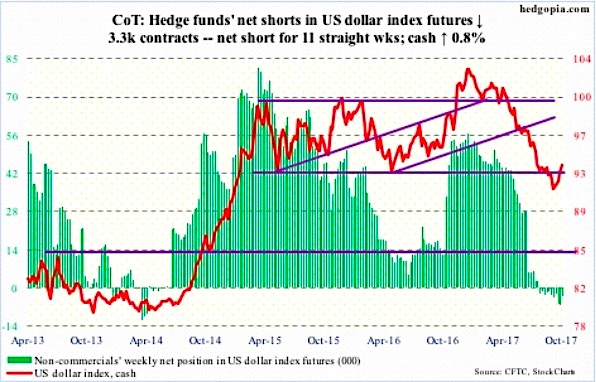
US DOLLAR INDEX: Currently net short 3.3k, down 3.3k.
Oversold weekly conditions on the US Dollar (CURRENCY:USD) kept unwinding. The US Dollar Index continued to push higher. Shorter-term moving averages are rising. The 50-day moving average is flattish, but looks to be on the verge of pointing up.
Near term, resistance lies at 94, which was unsuccessfully tested Friday. Down below, the bulls need to defend broken-resistance-turned-support at 92.50-60.
Thanks for reading.
Twitter: @hedgopia
Author may hold a position in mentioned securities at the time of publication. Any opinions expressed herein are solely those of the author, and do not in any way represent the views or opinions of any other person or entity.


