The prior two sessions had produced doji candlesticks for Gold. In normal circumstances, this would be bearish, unless negated. Did Friday’s trading do exactly that?
The metal went on to rally 1.5 percent on Friday, past 1,140ish resistance. Ditto with GLD. There is still room for it to move higher on a weekly chart.
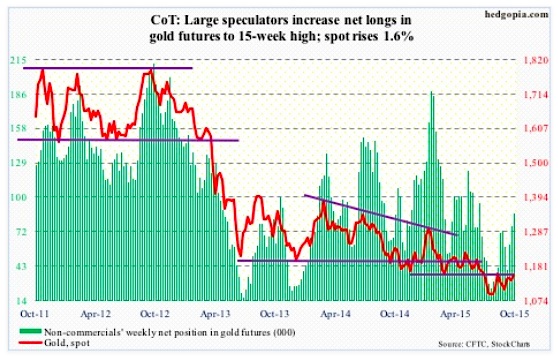
Non-commercials have been vindicated, as they have been adding to net longs in Gold. The metal made a low on July 24. The following week, these traders’ net longs bottomed, and have risen 255 percent since. Gold has followed.
From a longer-term perspective, spot gold has retraced 50 percent of the April 2001 low of 255.8 and the September 2011 high of 1,923.7 – always a good spot for gold bugs to put their foot down. Gold prices are holding above that retracement level, at 1090. So far, so good.
October 6 COT Report: Currently net long 86.8k, up 10.2k.
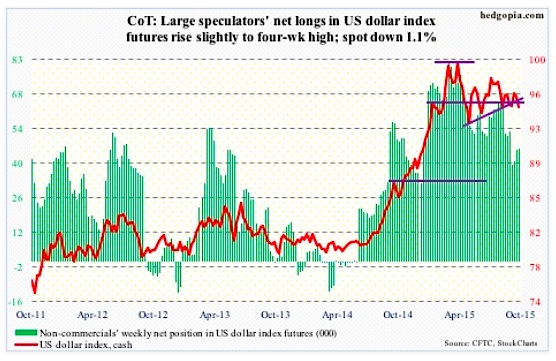
US Dollar Index: Dollar bulls are swimming upstream. A dovish message from the Fed, coupled with downward pressure on interest rates, is not helping their cause. Kudos to non-commercials who expected things to unfold this way. They had been cutting back on exposure to the US Dollar since March 10 when net longs peaked at 81,270 contracts. The US Dollar Index peaked a week later. Holdings have been nearly cut in half, and the index cannot get it going.
Several moving averages – particularly daily – converge in the 96 area, and the index is losing it. It is now below both 50- and 200-day moving averages. There is a potential death cross in the making, with merely 0.27 separating the two.
October 6 COT Report: Currently net long 46k, up 290.
Euro: Mario Draghi, ECB president, once again said the bank was ready to adjust its asset-purchase program, if needed. Board member Sabine Lautenschlaeger, on the other hand, says it is premature to discuss more QE. The game of carrot and stick continues. Since March, the ECB has been purchasing €60 billion a month of mostly government bonds, and the program runs until September next year.
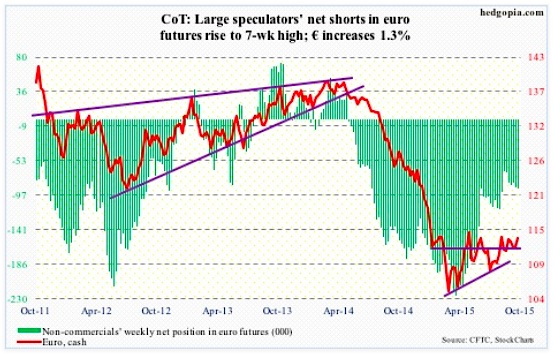
Non-commercials continue to lean bearish on the Euro.
The Euro went the other way, up 1.3 percent for the week, but also produced a daily doji right underneath the upper Bollinger band.
October 6 COT Report: Currently net short 88.8k, up 1.2k.
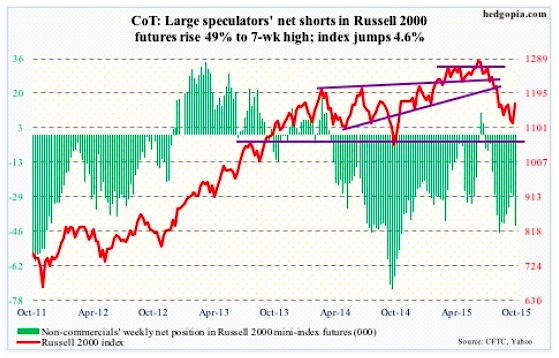
Russell 2000 mini-Index: Risk-on for small cap stocks? Looks that way. And some level of fear-of-missing-out (FOMO) in action as well. The Russell 2000 jumped 4.6 percent for the week, versus 3.3 percent for the S&P 500, 2.6 percent for the Nasdaq composite, and 3.7 percent for the Dow.
On the other hand, unlike the S&P 500 and the Dow, the Russell 2000 is struggling to convincingly get over its 50-day moving average, as is the Nasdaq composite. The Russell 2000 Volatility Index (RVX) gave back 13 percent for the week, but is trying to stabilize right above its 200-day moving average.
Non-commercials are taking the rally as an opportunity to add to their bearish bias, per recent COT report data..
October 6 COT Report: Currently net short 43.1k, up 14.1k.
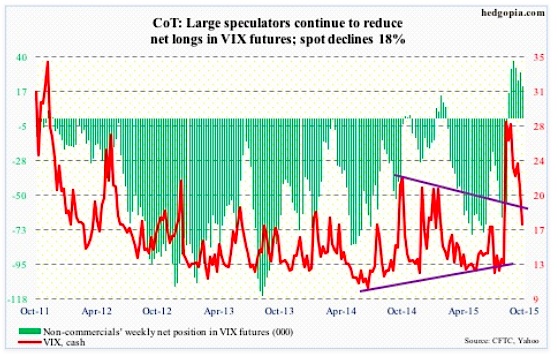
VIX – Volatility Index: After 30 sessions over 20, the streak is over for the Volatility Index (VIX). It ended on Monday, and VIX continued lower the next four sessions. Thursday, the spot tested the 200-day moving average, and it held – has not been below that average since August 18, right before the four-day spike to 53.29 on August 24. That was the week non-commercials went net long – for the first time since February this year. And they kept adding, peaking at 37,925 contracts by September 8. They have stayed net long for seven weeks now. In the meantime, spot VIX has gone the other way. They are still net long, but cut this week. Oddly enough, the Volatility Index could be on the verge of making a move higher near-term.
October 6 COT Report: Currently net long 21.1k, down 9.2k.
Thanks for reading.
Twitter: @hedgopia
Read more from Paban on his blog.
No position in any of the mentioned securities at the time of publication. Any opinions expressed herein are solely those of the author, and do not in any way represent the views or opinions of any other person or entity.


