The following is a recap of the January 20 COT Report (Commitment Of Traders Report) released by the CFTC (Commodity Futures Trading Commission) looking at COT data and futures positions of non-commercial holdings as of January 17.
Note that the change in COT report data is week-over-week. Excerpts of this blog post also appear on Paban’s blog.
3 Charts Highlighting Speculative Futures Trading Positions in Crude Oil, Gold and the US Dollar
CRUDE OIL
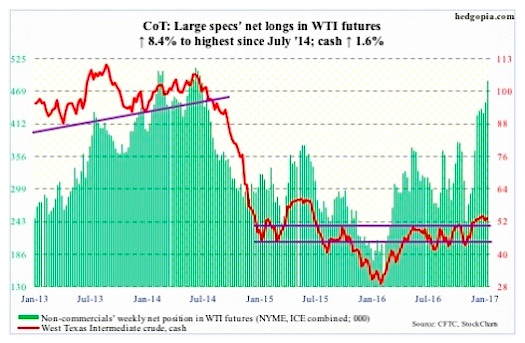
For the sixth straight week, oil bulls have now been rejected at $54-plus on spot West Texas Intermediate crude oil. This week produced another doji – 6th in last seven weeks. Thus far, $52 has been defended, but it is probably only a matter of time before this gives way.
The crude oil has essentially gone sideways since December, even as non-commercials’ net longs in WTI futures went up 62 percent – now highest since July 2014. This raises the risk that these traders lose patience at some point – particularly if $52 is lost.
A rising trend line drawn from the February lows (2016) converges around $47-$48.
The latest EIA report was mixed at best.
For the week of January 13, crude stocks went up by 2.3 million barrels to 485.5 million barrels. Gasoline stocks rose by six million barrels to 246.4 million barrels – the highest since March last year. And, refinery utilization fell by 2.9 percentage points to 90.7; the prior week was a four-month high.
Distillate stocks dropped by 968,000 barrels to 169.1 million barrels; the prior week was the highest since October 2012. Crude oil imports fell by 674,000 barrels/day to 8.4 million b/d. Similarly, crude oil production inched down 2,000 b/d to 8.9 mb/d; the prior week was the highest since April last year.
January 20 COT Report: Currently net long 487.7k, up 37.8k.
GOLD
At long last some inflows. After nine consecutive weeks of outflows totaling $5.7 billion, the SPDR Gold ETF (NYSEARCA:GLD), attracted $115 million in the week ended Wednesday (courtesy of ETF.com).
Too little, too late?
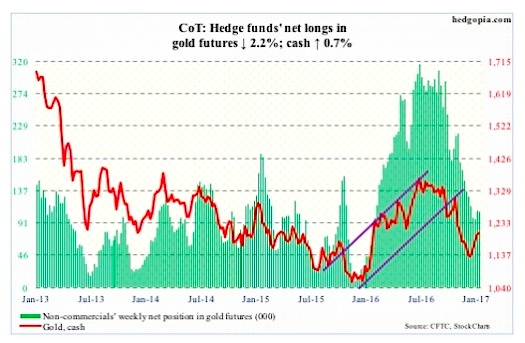
From December 15 through January 17, gold prices rallied 8.4 percent, rallying past several important averages. Leading up to and throughout all this, the Gold ETF bled.
Now, daily technicals are in overbought territory, with Gold ($1,204.9/ounce) acting as if it wants to head lower.
Gold bugs need to defend $1,185, which also approximates the 50-day moving average.
January 20 COT Report: Currently net long 107k, down 2.4k.
US DOLLAR INDEX
History was made this week. Sort of. The cash dropped 0.9 percent on Tuesday responding to President-elect Donald Trump’s statement he made to the Wall Street Journal on Friday last week that the strong dollar was killing U.S. companies’ ability to compete.
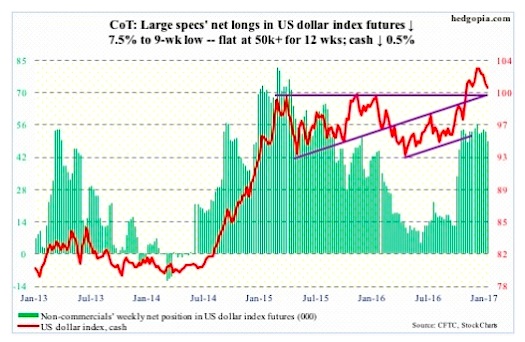
US Dollar bulls were already struggling to save last November’s breakout. The president-elect’s comments did not help. On Tuesday, the dollar index sliced through its 50-day moving average, and an attempt to reclaim the average in the following threee sessions failed.
That said, the US Dollar Index is oversold on a daily basis. The area of interest remains 102. Inability to rally past this support-turned-resistance increases the odds that overbought weekly conditions continue to get unwound.
A rising trend line drawn from the May 2016 low gets tested around 98.
January 20 COT Report: Currently net long 49.1k, down 4k.
Thanks for reading.
Twitter: @hedgopia
Author may hold a position in mentioned securities at the time of publication. Any opinions expressed herein are solely those of the author, and do not in any way represent the views or opinions of any other person or entity.


