The S&P 500 Index has been making higher highs through the first four months of 2021, along with infrequent pullbacks which have been mild and short-lived. When I was taking flight lessons, I was taught that the best time to develop an emergency plan is when things are going well. If you’re trying to find a nearby airport right when your engine cuts out, it may be too late!
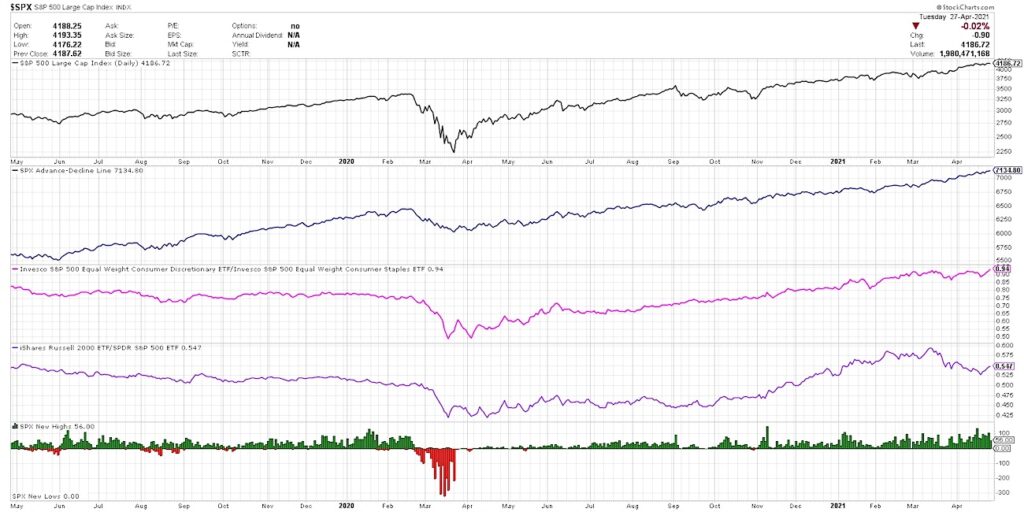
With that in mind, I put together what I call “The Chart to Watch for Market Tops.”
Most of the stock market indicators on this chart are currently bullish, as they should be with the market making successive higher highs. But internal weakness and momentum changes should be reflected on this chart early on in a correction, which means this is the chart to follow to determine when to consider a rotation from risk-on to risk-off in your portfolio.
– How these five indicators are currently describing the market uptrend and confirming bullish conditions
– What signals would indicate a rotation from risk-on to risk-off and suggest a higher probability of corrective price action
– How some of the indicators speak also to leadership rotation and a potential improvement in areas like small caps and value stocks.
For deeper dives into market awareness, investor psychology and routines, check out my YouTube channel!
One Chart To Watch For Market Tops [VIDEO]
Twitter: @DKellerCMT
The author may have positions in mentioned securities at the time of publication. Any opinions expressed herein are solely those of the author, and do not in any way represent the views or opinions of any other person or entity.


