The August jobs report on Friday showed that 173k jobs were created, below the 210k that was expected. The good news is both June and July jobs were revised higher to 245k. There’s a good chance August will be revised higher also, as that has been the recent trend.
Now here are 8 things that you need to know about the August jobs report.
1. This was just the second month beneath 200k over the past 18 months. March ‘15 came in at only 126k.
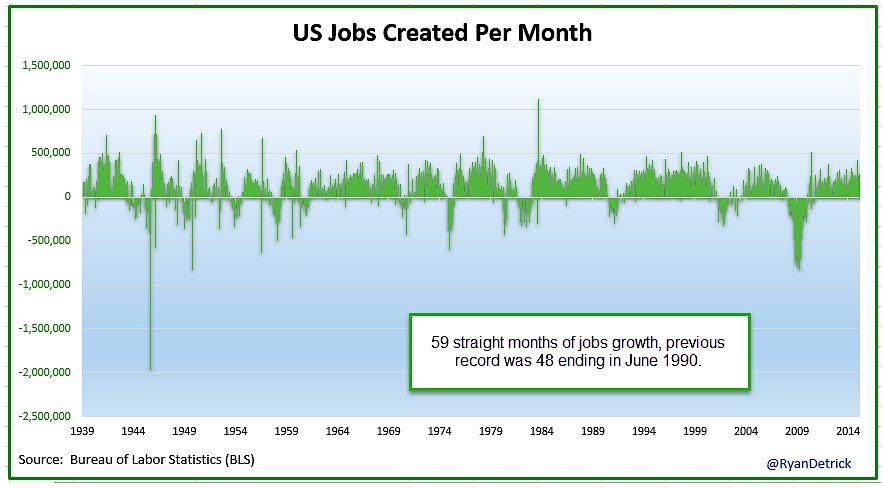
2. Including the August jobs report, we’ve seen jobs growth for an incredible 59 straight months now. The previous record was 48 months ending in 1990.
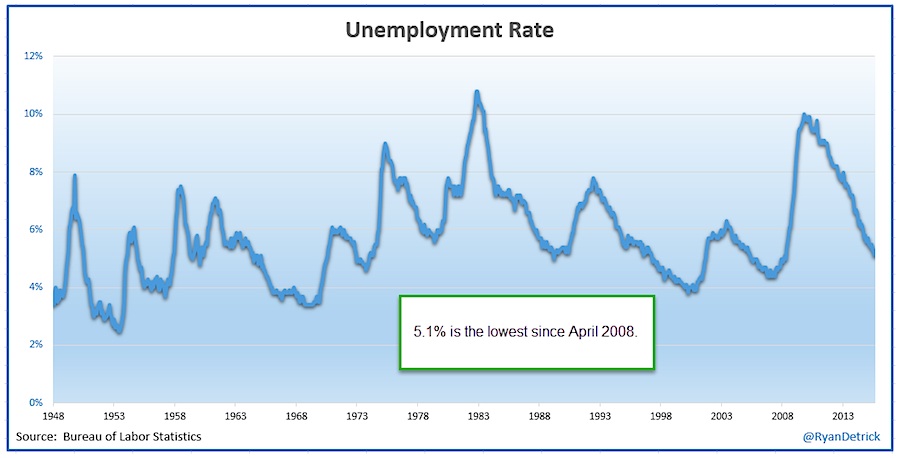
3. The unemployment rate is clear down to 5.1%, the lowest since April 2008.
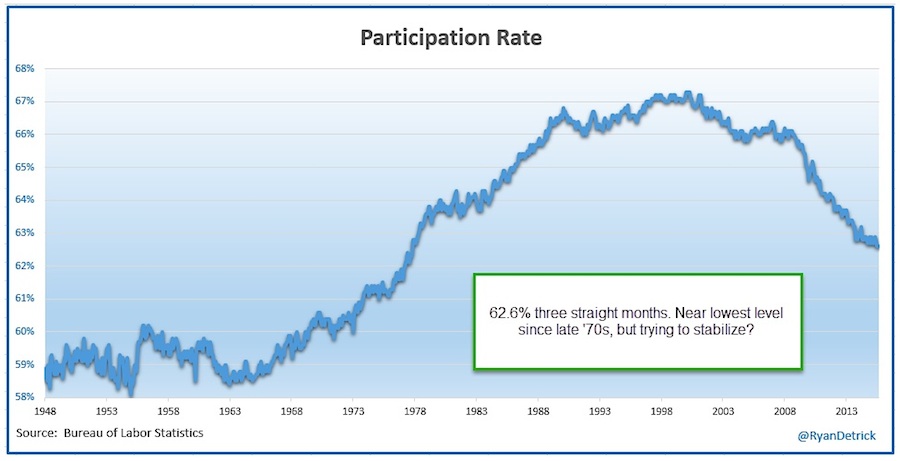
4. The bad news? The participation rate is still down at 62.6%. This is near the lowest level since the late 1970s. You could argue this says people are just giving up looking for employment. The good news is this appears to be stabilizing, as it has been at 62.6% for three straight months.
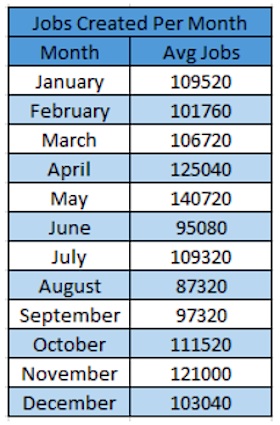
5. A weak August jobs report shouldn’t come as a shock. Since 1990, no month has created less jobs.
6. 2015 is still creating 221k job per month on average. This is the second best year going back 16 years.

: Showing Some Signs of Emerging Strength")

