How do you know when a stock or ETF has truly bottomed?
Not guessing. Not hoping for. An actual bottom.
There’s a simple signal professional traders watch for — and when it appears, it often marks the moment sellers are exhausted and buyers quietly step in.
First, we want to see a new 60-day low.
That fresh low matters. It shakes out weak hands, triggers emotional selling, and creates what traders call capitulation. Without that flush, a real bottom is less likely.
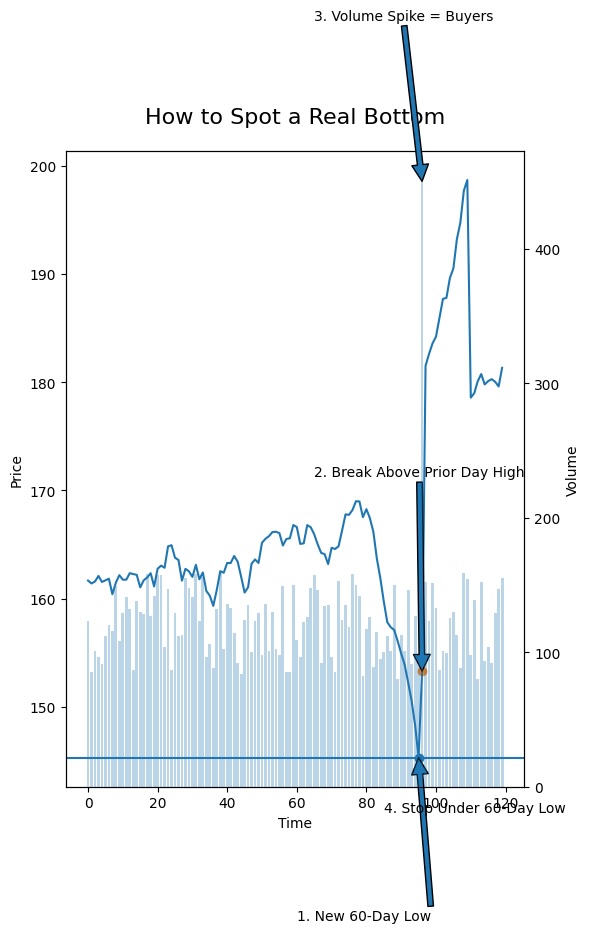
But the low alone is not enough.
The next step is the real tell:
the very next day, price must break above the prior day’s high.
That’s the shift. Sellers pushed price down — but buyers immediately took control. When price can reclaim and exceed that prior high so quickly, it signals demand has returned.
Then we look to volume for confirmation.
A bounce on light volume can fail.
A bounce with a clear volume surge shows institutions and serious money stepping in. Volume is proof that the reversal has participation.
Finally — and this is the part that separates traders from gamblers — we define risk.
The stop goes right under the day of the 60-day low.
If price breaks that low again, the bottom isn’t in.
We exit quickly and keep capital protected.
This simple four-step process:
1. new low → break prior high → volume → defined stop
gives traders a structured way to spot potential market bottoms without guessing.
2. Learn the pattern.
3. Respect the risk.
4. And let the market confirm when the bottom is truly in.
Twitter: @marketminute
The author may have a position in mentioned securities at the time of publication. Any opinions expressed herein are solely those of the author and do not represent the views or opinions of any other person or entity.


