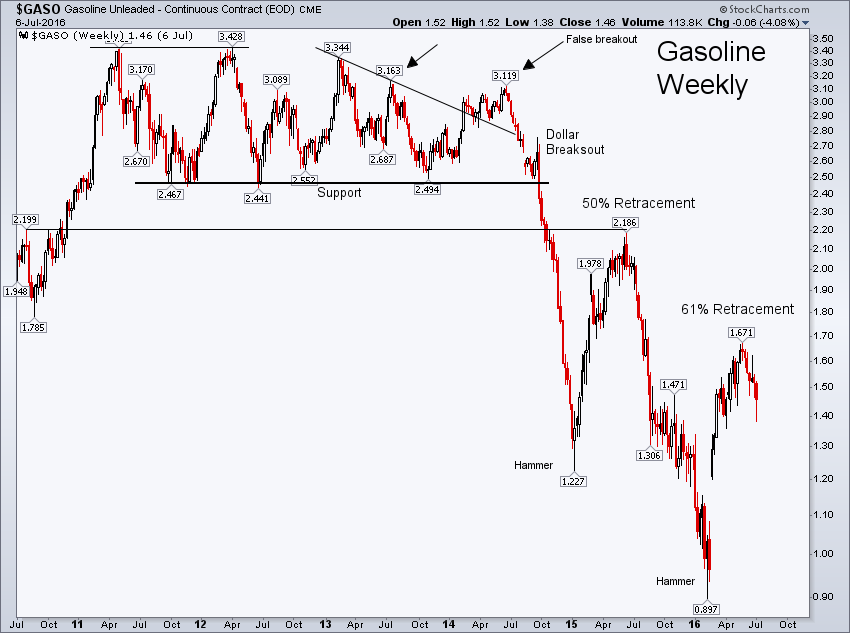
In December, we noted how Tesla Motors (NASDAQ:TSLA) hit an all-time high as gasoline prices broke $2.50 support during the summer of 2014.
You can see that chart below, indicating that a Tesla top was a growing concern.
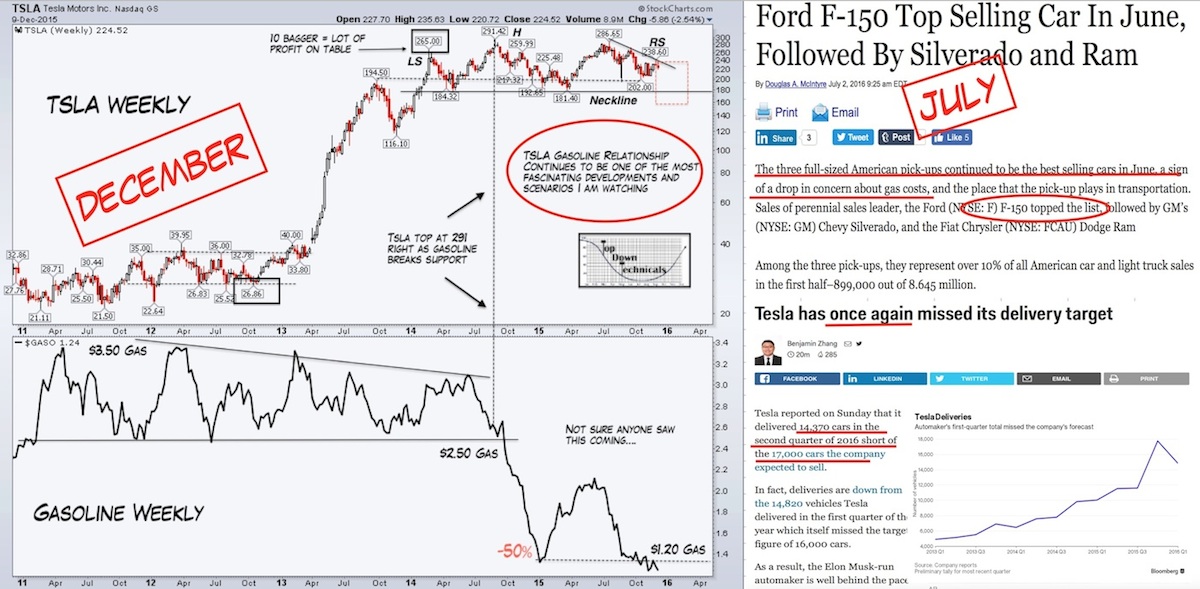
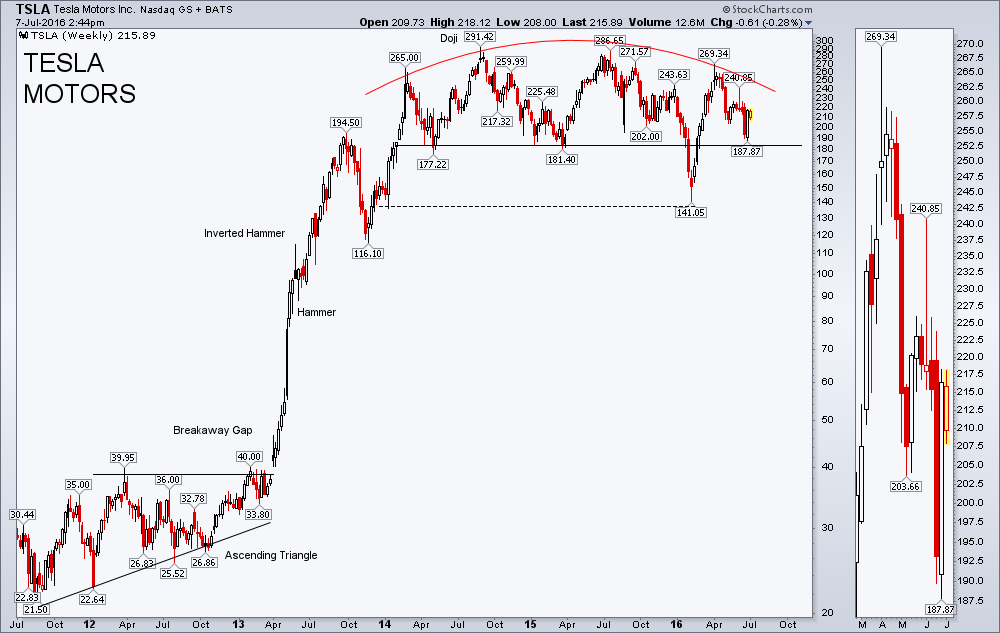
Since the top, Tesla has chopped above its 180 neckline carving out a rounding top/Head & Shoulders pattern.
In June, the top three selling U.S. cars were again full-sized pick-ups while Tesla (TSLA) missed its delivery target.
The questions to ask now: Is sub-$2.50 gas a cap on the electric car maker? Could an intermediate-term Tesla top already be in?
We will be watching.
Tesla (TSLA) Weekly Chart
Gasoline Prices Weekly Chart
Thanks for reading.
Twitter: @JBL73
The author does not have a position in any mentioned securities at the time of publication. Any opinions expressed herein are solely those of the author, and do not in any way represent the views or opinions of any other person or entity.


