Tesla Motors (TSLA) reports Q3 2013 earnings just following the bell today. Estimize consensus pegs the release of Tesla Earnings at $0.22 EPS with revenues of $564.95 million, figures representing a sound beat of the Wall Street consensus of $0.12 EPS and 553.46 million (read See It Market’s interview with Estimize founder Leigh Drogen here).
Ahead of the print, my appraisal of TESLA is one of technical balance, with price-based pros and cons present across time frames.
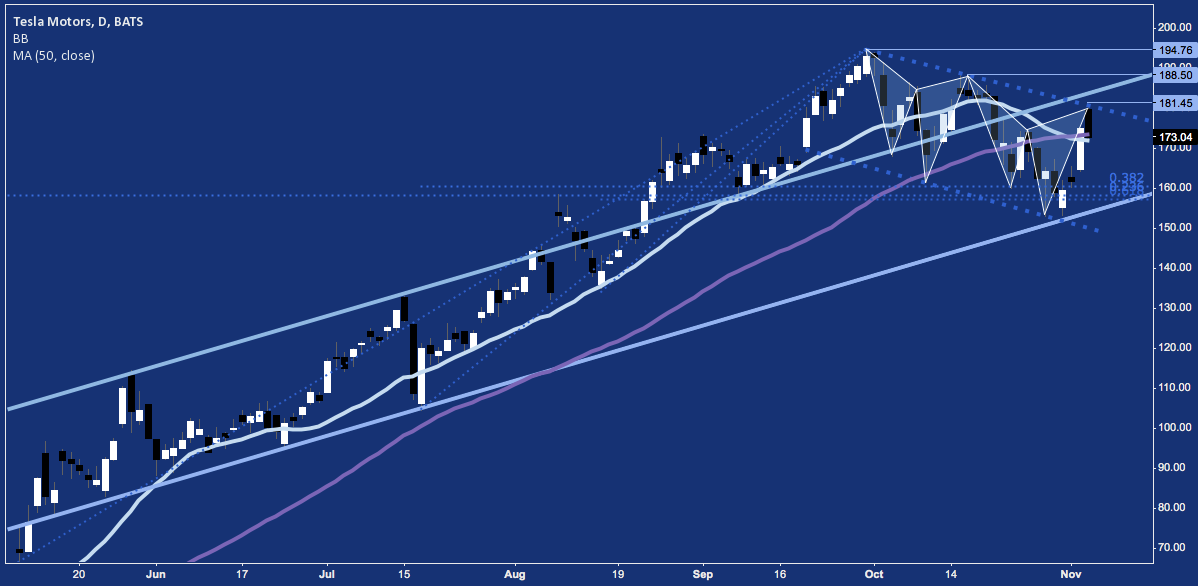
Short-term, TESLA spent October in a descending channel that is now spilling over into November. This channel marks a return to the longer-run primary trend rising channel begun after Q1 Earnings in May.
Following a 3-day bounce off fibonacci cluster support between $155-$160 today’s open brought a solid gap-up, beginning trade at $180, right on channel resistance. Opening trade took the stock as high as $181.43 before fading 6% to cut into yesterday’s range and chip away at its 20-Day and 50-Day Simple Moving Averages. The 20-Day proved an impenetrable support floor throughout the third quarter, but had negligible relevance since mid-October. Proximity to the 50-Day – a line not touched since late March – may provide important support, but is otherwise indicative of the slowing momentum that has characterized TESLA since October began.
TESLA Motors (TSLA) – Daily: Descending Channel into Key Moving Averages
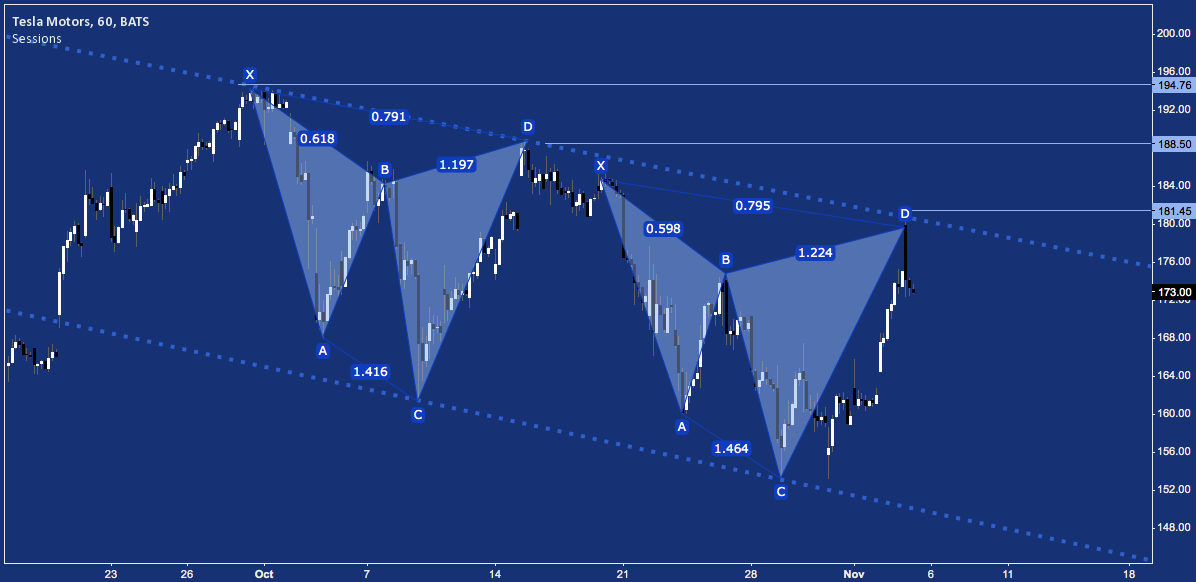
Inside the 5-week channel, TESLA has formed a pair of two Bearish Cypher harmonic patterns. To get an idea of what can follow the current pattern, see the first: a -15% move in (from D’s swing high through X to A’s swing low) 7 trading days. A similar move off today’s high at D looks for $154, near the current pattern’ point C. That outcome brings the stock back to last week’s lows – with the next major support rung beneath it at $133-$135 realistic on a significant TESLA earnings disappointment.
Tesla Motors (TSLA) – 1 Hour: Dual Cyphers
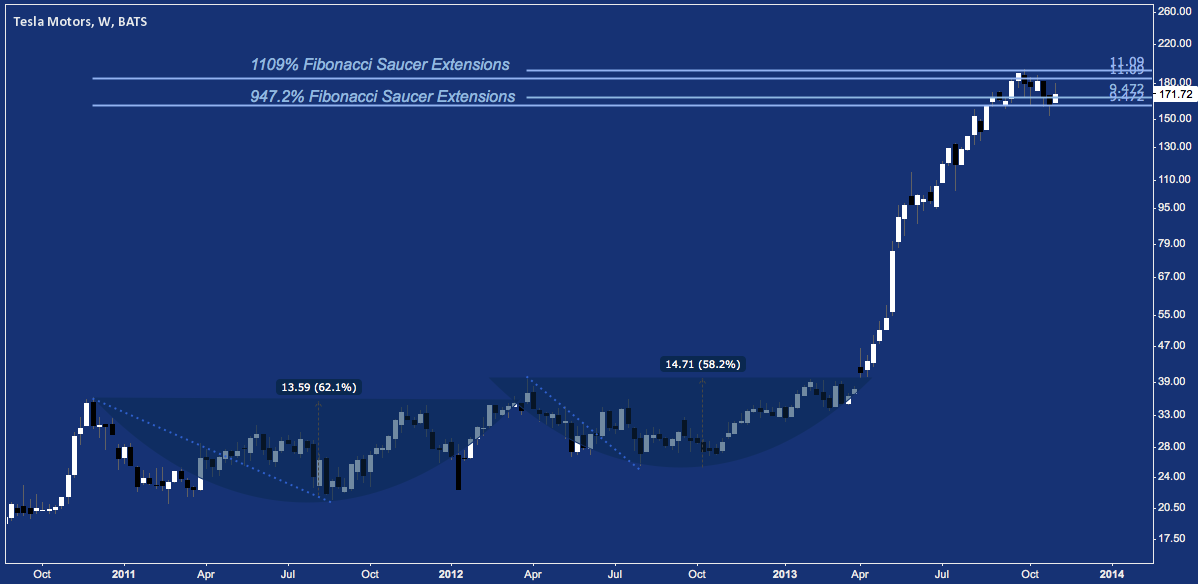
This channel and these patterns articulate the net lack of progress TESLA has made since late August. As much as a testament regarding the stock’s parabolic rise this year as a level of immediate resistance, this has all occurred between the 947.2% and 1109% (yes, those are legitimate fibonacci levels) extensions off the saucer bottoms that marked late 2010-early 2013.
Tesla Motors (TSLA) – Weekly: Extreme Fibonacci Resistance
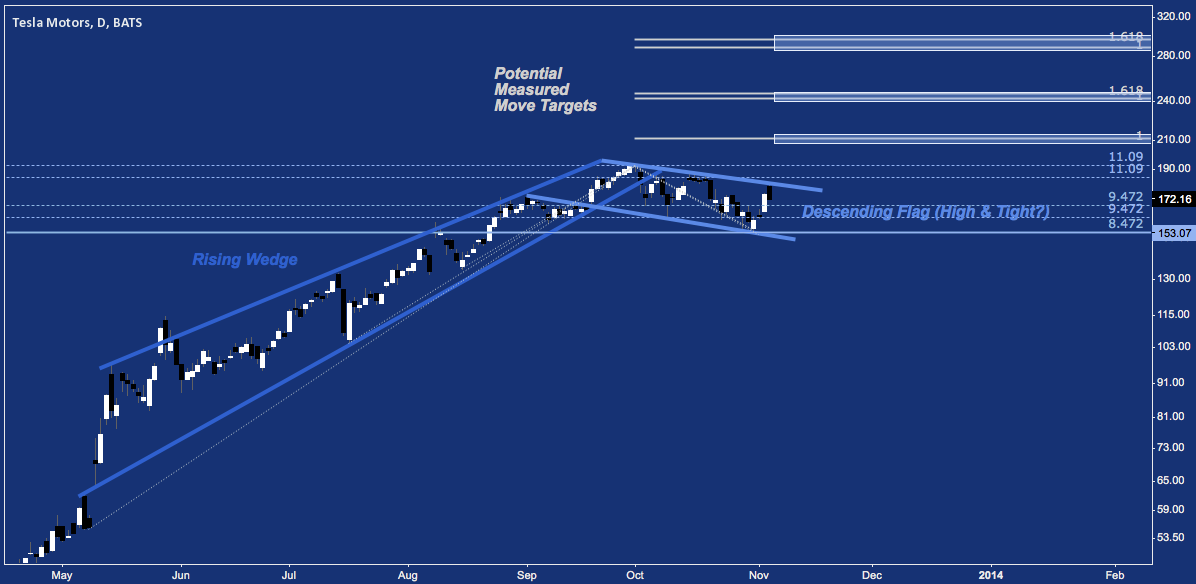
Where’s the balance? Each of these markets points to a very bullish scenario that may following TESLA earnings, as well. The 1109% and 947.2% extensions have marked the range extremes of a descending channel/flag in TESLA‘s primary rising trend. This is a potential High & Tight Flag that may be setting the stage for a measured move up above 181 and 09/30/13’s $194.49 all-time high, toward one of several targets near $210, $240 and even as high as $290-$300. Those levels are projections, not forecasts; but the setup to this point makes them a plausible medium-term (i.e. approx. 3-12 months) outcome.
Tesla Motors (TSLA) – Daily: Measured Moves Up, Possible High & Tight Flag
Twitter: @andrewunknown and @seeitmarket
Author holds no exposure to securities mentioned at the time of publication.
Any opinions expressed herein are solely those of the author, and do not in any way represent the views or opinions of any other person or entity.

 Flirting With Critical Support… Again")


