Today we revisit an incredibly important stock market ratio: The Semiconductors Sector $SMH versus the S&P 500 $SPY.
This ratio highlights how an important tech leadership group is performing versus the broad market. And considering that tech stocks lead the market higher over the past 13 years, well, it’s important.
We’ve highlighted this ratio several times this year, following its breakdown through price support, and its latest test of resistance (before falling again!).
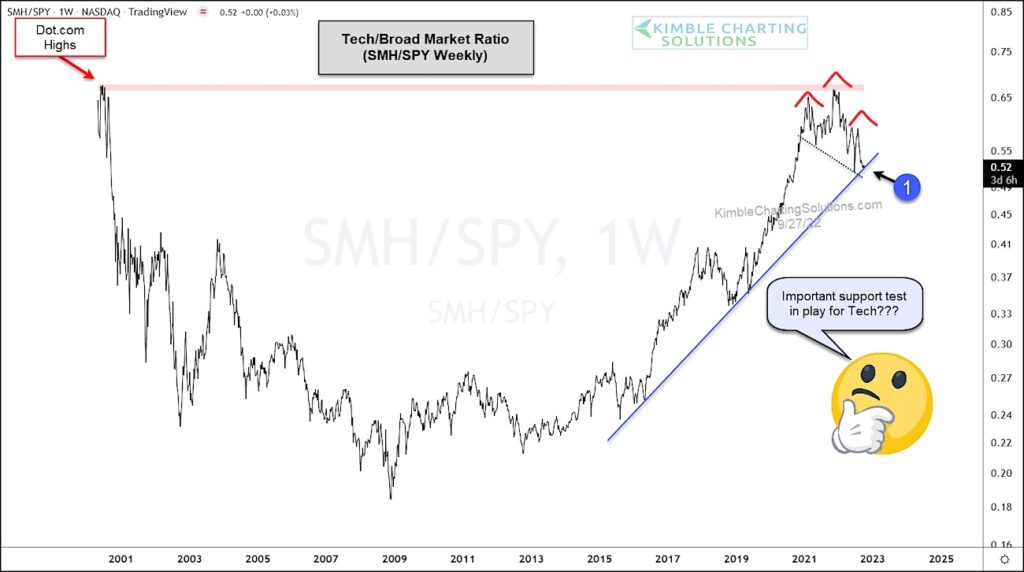
Below is a “weekly” chart which highlights a bearish head and shoulders pattern breakdown that formed as a double top at the Dot.com highs. Yikes!!
The chart has a heavy feel to it so bulls are going to need some super strength for the save. Their opportunity is now and they must begin to see buying. The $SMH to $SPY ratio is testing its long-term trend line support at (1).
This humbly looks to be quite an important test for investors and the broader market! Stay tuned!
$SMH Semiconductors ETF versus $SPY S&P 500 ETF “weekly” Ratio Chart
Note that KimbleCharting is offering a 2 week Free trial to See It Market readers. Just send me an email to services@kimblechartingsolutions.com for details to get set up.
Twitter: @KimbleCharting
Any opinions expressed herein are solely those of the author, and do not in any way represent the views or opinions of any other person or entity.

: Worrisome to Broader Market?")
