With interest rates rising / elevated, growth stocks are struggling. And in today’s market, growth stocks often are tech stocks.
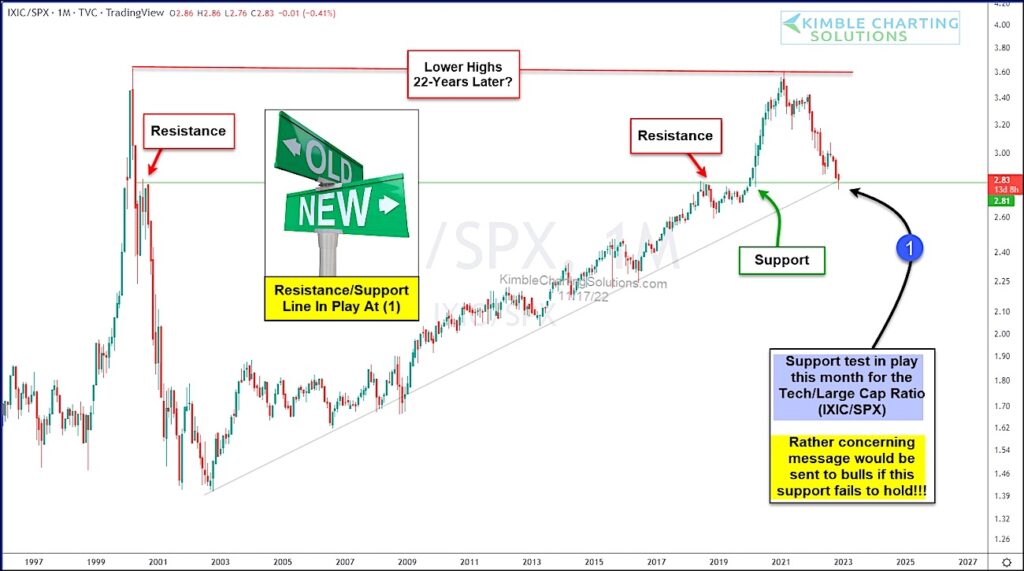
Today’s chart looks at the performance ratio of the Nasdaq Composite to the S&P 500 Index (large caps).
As you can see, the tech/large cap ratio is down around 25% since the top last year. This clearly highlights the weakness in tech stocks.
That said, this important ratio remains above its 20-year rising price support. It is also trading at a key price support/resistance line that dates back to a counter-trend rally in late 2000. Can this dual support hold?
I find it crazy how the world has created this situation with a darn ratio… in my humble opinion, it would be rather concerning if this dual support fails to hold. Stay tuned!
Nasdaq Composite to S&P 500 Index Ratio “monthly” Chart
Note that KimbleCharting is offering a 2 week Free trial to See It Market readers. Just send me an email to services@kimblechartingsolutions.com for details to get set up.
Twitter: @KimbleCharting
Any opinions expressed herein are solely those of the author, and do not in any way represent the views or opinions of any other person or entity.

: Cup (and Maybe Handle) Watch")
 Trading Near Top Of Price Range")

