Tech stocks continue to lead the market higher, with the Nasdaq Composite and Nasdaq 100 recording intra-day all-time highs. BUT something isn’t right beneath the surface.
And it could be a rally killer. I emphasize “could”.
The 12-year bull market has been lead by tech stocks… and for the past 15 years, tech stocks have been lead higher by large cap tech stocks.
What does that mean?
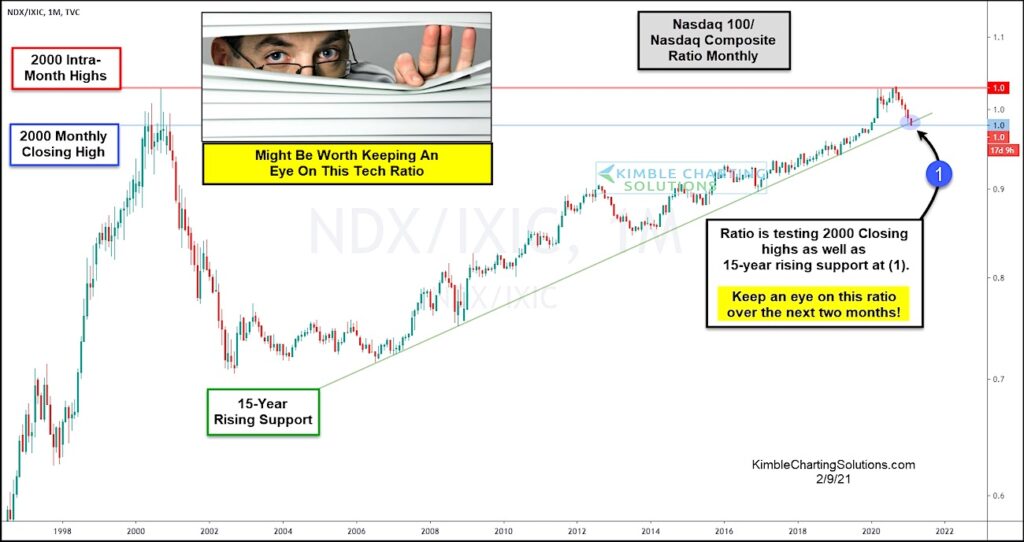
The Nasdaq 100 Index has out-performed the broader Nasdaq Composite. You can see this in today’s long-term “monthly” ration chart.
This ratio has been in an up-trend marked by (1) for 15 years. But the ratio has reversed lower and is suddenly testing its rising support line and year 2000 closing highs… also at (1). And it’s happening when everything “feels” right in the market.
Bulls will get a bearish signal if this trend line breaks in the months ahead, so stay tuned!
Nasdaq 100 / Nasdaq Composite Ratio Index “monthly” Chart
Note that KimbleCharting is offering a 2 week Free trial to See It Market readers. Just send me an email to services@kimblechartingsolutions.com for details to get set up.
Twitter: @KimbleCharting
Any opinions expressed herein are solely those of the author, and do not in any way represent the views or opinions of any other person or entity.


