Investors are hoping that a strong January is just the start to a strong recovery for stock prices. Particularly, tech stock prices.
The selloff hit tech stocks particularly hard as a slowing economy and inflation are strong headwinds for growth stocks. Investors hope these headwinds slow, or go away in 2023.
Today, we look at the chart of an important stock market index to see what may be brewing over the coming months…
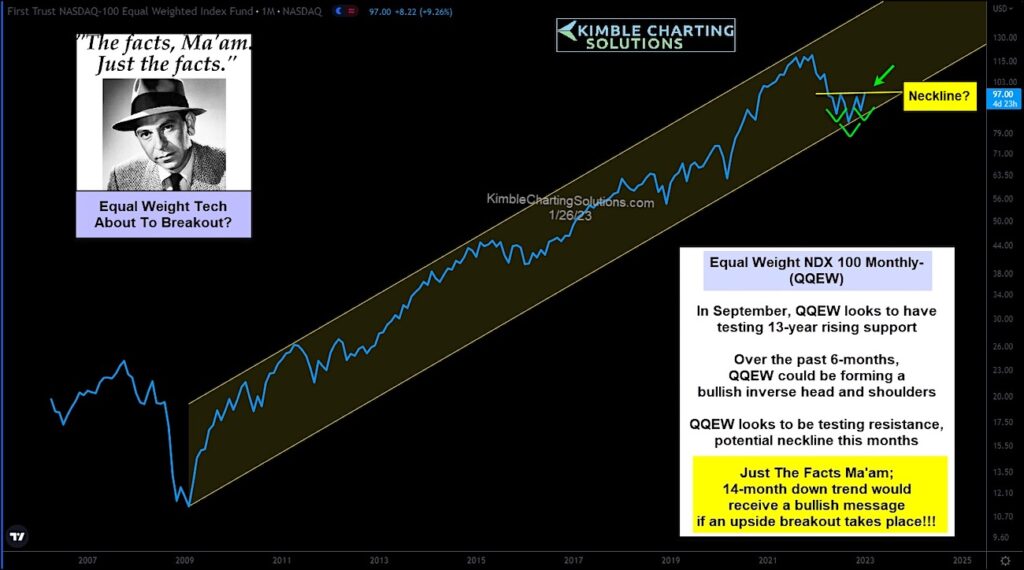
“The facts, Ma’am. Just the Facts.”
Below is a long-term “monthly” line chart of the Equal Weight Nasdaq 100 ETF (QQEW). We can see that despite the vicious selloff, QQEW held its rising 13 year price channel support.
The stair step bounce that has ensued has helped to form a very bullish stock market pattern: an inverse head and shoulders. Currently, price is testing the neckline of this pattern. This will turn bullish IF a breakout takes place here.
A tech breakout would also send a bullish message to the broader market and economy. Stay tuned!!
Equal Weight Nasdaq 100 ETF Chart
Note that KimbleCharting is offering a 2 week Free trial to See It Market readers. Just send me an email to services@kimblechartingsolutions.com for details to get set up.
Twitter: @KimbleCharting
Any opinions expressed herein are solely those of the author, and do not in any way represent the views or opinions of any other person or entity.

: Showing Some Signs of Emerging Strength")

