By Andrew Kassen Hugo Chavez is dead. The late Venezuelan President’s body – lately succumbed to the ravages of cancer and a massive heart attack this past week – will be interred in “crystal glass” so it can be “displayed for eternity” according to Vice-President Nicolas Maduro. Last time we heard this story, the main character was named Lenin.
As news goes, though, that was a sloughed off as a passing curiosity in most quarters. According to my unscientifically scientific snap poll, 100% of Americans (sample size of 2) don’t even know who Chavez is and – already encumbered under the weight of pure bafflement – made stumbling, quizzical utterances like “wasn’t he some boxer, or something?” when pressed.
To be fair, that wasn’t the big news of the week. Nor the question of how the domestic use of military drones squares with US privacy law (a debate mostly rendered moot by social media and reality television-predicated public inurement to voyeurism). Perhaps most shockingly, the incarnation of Emperor Palpatine was passed over with nary an annunciatiory editorial of lament or foreboding.
What relegated the exigency, priority and relevance of all of this to the virtual page A13 of the 24-hour news cycle? You know this answer:
<<<THE DOW JONES INDUSTRIAL AVERAGE ESTABLISHED A NEW ALL-TIME HIGH>>>
Specifically: on March 5th the Dow Jones Industrial Average (DJIA) surpassed its previous 10/11/2007 nominal all-time high of 14198, pushing as high as 14286 before closing at 14254 – new Dow Jones all time highs.
On March 6th, the venerable, price-weighted anachronism (read: “old goat”) of an index did it again. And then again. And then again, closing out the week on March 8th at 14397, just shy of its 14413 high set earlier in the day. When all was said and done, this most important of Mom-n’-Pop economic metrics – aside from the price of gas, anyway – closed out a week of living history +1.38% over that stratospheric height set in Fall 2007.
In the classic, time-honored fashion of the market sentiment cycle, the watermark of Dow Jones all time highs triggered a blinding flurry of articles, typified by this NYT Business Section lead published in the basking morning afterglow following March 5th’s record-setting finish. Or try “As Fears Recede, Dow Hits a Milestone” (which in a classic case of narrative doublespeak is browser-tagged as “Cheers Are Few As Dow Jones Average Hits Milestone”).
To the credit of their author’s journalistic integrity, these articles give equal hearing to optimistic and pessimistic sides of the coin, calling up all the usual suspects: for each Laszlo Birinyi, there’s a David Rosenberg. And fittingly so: there’s a host of indicators, metrics, datapoints, cyclical precedents and broader theses one can deploy to make a bullish or bearish argument from here. In other words: there’s no shortage of data a pundit can tap to explain why the Dow at a new all-time high is fantastic news; or how we’re obliviously skipping at the edge of an abyss – as we did in the ostensibly simpler, kinder time of 5+ years ago.
Of this week’s pro/con litanizing, Ryan Detrick’s (Schaeffer’s Investment Research) review was among the most insightful for its balance and selection of broad, historically significant market measures. Best of all, though Ryan finds “the weight of the evidence” bullish at present, his analysis doesn’t lock the market into an analytical rail, but provokes some thoughtful questions.
Inevitable Retail Euphoria?
One theme in already-wide circulation that the Dow Jones all time highs kicked into overdrive is the absence of individual/retail/dumb money stock-buying euphoria. Mom-n’-Pop have been mostly aloof of Stocks in a featureless 4-year sleep following Lehman. As the general argument goes, this segment of market participants must enter an ecstatic state exhibiting “irrational exuberance” where stocks are bought – often on borrowed funds – with a regressive, ebbing concern for risk and fiscal prudence. At this point, as the currently prevailing wisdom goes, these hapless bagholders are not in a manic state over stocks. Indeed, they’re still held fast in the dreamland to which they escaped from the rampaging bear, now so many months ago.
I’m not a contrarian – I don’t see much pragmatic benefit to naysaying a market or a trend until it can’t meet its own burden of proof (see my previous piece about Deconstructing the Rally for more on this) – but this observation is a bit too prevalent to deserve our unquestionable assent.
Speaking of metrics, one popular measure used to test for euphoria among the individual investor is ICI’s estimate of long-term Mutual Fund flows. The idea here: if individual investors are pouring money into mutual funds (regarded as an instrument favored by the less-sophisticated), ICI’s net flows metric will rise; and once it rises high enough, it is indicative of drunken stock excess. Conversely, if individuals aren’t lining up in sustained interlude of speculative inebriation, the market has a long way to go.
I like Ryan’s chart because it smooths out the data series by plotting trailing-12-month cumulative flows:
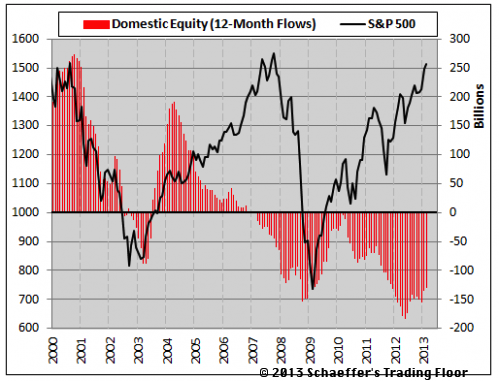
There’s no doubt the argument in 2000-2002. You’ll notice at the far-left of the chart that domestic equity flows fell off a cliff in lockstep with stocks as investors fled mutual funds with US exposure.
Things begin to get interesting after the late 2002 market bottom. Flows come back, but cap out in early 2004 and then slide back to negative in early 2007 (in fact, emerging market and Developed ex-US flows were comparatively stronger during this period), pre-dating the market top by the better part of a year.
Flows claw their way out of the basement set in late 2008 into the cessation of QE1 in Spring 2010, almost breaking positive; and then something mysterious happens: though domestic equities have rallied approximately 50% since mid-2010, fund flows have been negative: all the more so in the wake of the Summer 2011’s debt ceiling debacle and the S&P US sovereign downgrade.
Enough history for a moment. What happened to individual investors after Spring 2010, and then Summer 2011? We can weave a narrative individuals began to crawl from their shell at these points but in their fragility quickly found reason to retreat yet again. That is reasonably well-grounded and plausible based on the ICI dataset.
This argument extrapolates two propositions from the ICI data: 1) flows continue to remain firmly entrenched in negative territory as ICI indicates (January 2013 was the first positive month since April 2011); and moreover, 2) at most, negligible retail participation was necessary to produce the move from mid-2010’s SPX 1011 low to the present level of 1551.
Here’s the disconcerting question: Why does retail matter now? All 130% of this domestic equity rally (and those happy Dow Jones all time highs!) has been produced in a state of skepticism, ranging from mild to vehement. If retail was irrelevant to the production of that gain, and ICI flows so utterly disconnected from the positive momentum of equities, why is individual investor euphoria – hopelessly irrelevant to date – suddenly the crux and sine qua non without which a significant correction or cyclical top cannot occur?
I know, I know: the cookie-cutter rejoinder here is that the smart money accumulating for the past 4 years needs someone to distribute to; i.e. institutional, hedgies and real money high rollers need the downtrodden, evasive dime-slot-machine-grade investor to wake up, bubble over with excitement and go all in so they push their soon-to-be-rapidly-depreciating chips across the table to them and walk out.
But, that’s insupportable this time around. MF flows and the broad market have been going in opposite directions since 2009, especially so since mid-2011. Domestic equity inflows have held no positive causal value for this cyclical bull. Other than the positive reflexive detritus it throws off, why do new Dow Jones highs change that? If the individuals reading these headlines were entirely irrelevant on the way up, what transforms them from impotent to indispensable for a move down?
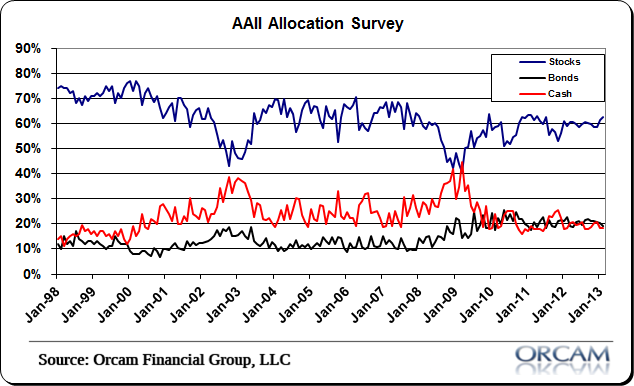
Maybe MF net flows aren’t so descriptive after all. The AAII Allocation Survey, for example, saw a significant bump in stock purchases from 40% to through 2009, around which it has oscillated ever since (currently 61.4%, the highest reading since July 2011).
Or maybe there’s a secular shift in the behavior of individual investors few analysts are entertaining. Such shifts have happened before.
A Brief Look Left
Market technicians spend a lot of time “looking left” or evaluating where price has been and how it behaved in the past – sometimes in the far-distant past. Among other benefits, this helps to relieve their perception of the current market context of the recency effect.
One lesson of history is that individual investors – the dumb money – have not always participated as strongly in stocks as they have in the past 20-30 years. When they have participated in earnest (1940s-1960s and 1984-2007) we have seen secular bulls; when they’ve withheld their participation (e.g. 1966-1982 – to wit, as Chris Kimble notes, the widely-recommended “Nifty 50” trade was “Dead Money” over this period), we have seen secular bears. The dynamics around the turns may have been marked by excessive elation or despondency and it isn’t as if individual investors haven’t been involved (quite to the contrary); but there’s no doubt the “dumb money” appellation and the snickering derision the word “retail” receives in the ivory tower is not the implicit testimony of history.
Hyrdrochloric Acid, Gearing Out and Other Ways to Blow Yourself Up
New Highs, Smart Money In, Dumb Money Not In. If only the Working Schlub-401k Set knew how much their Wall Street wealth suzerains need their act of sacrificial stock-sucking serfdom to offload their rapidly appreciating equity positions! They’re longing to say those three simple words: the great milestone and turning point in a storied relationship: “sold to you!”
Another measure of “sentiment” Ryan looked at and which I favor is NYSE Margin Debt (i.e. utilization of margin credit). Perhaps the most informative chart out there on this is from BoA/ML’s Mary Ann Bartels, by way of Matt Boesler’s article (click to enlarge):
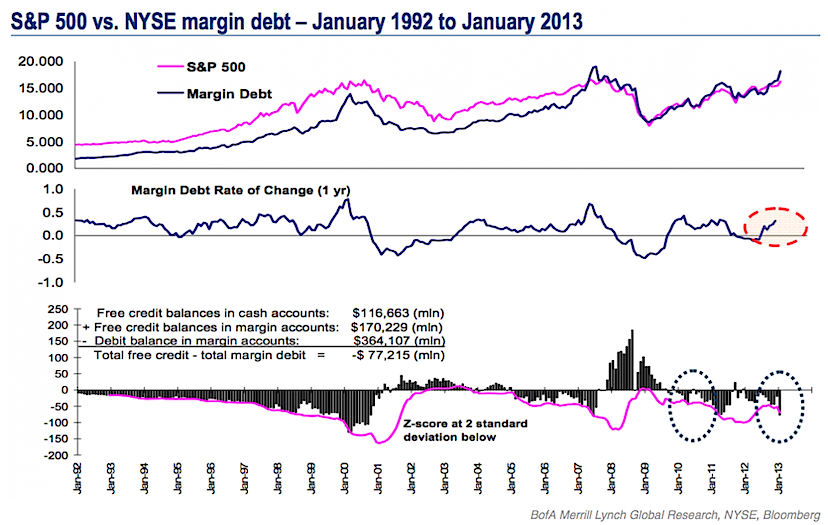
Mary Ann’s data may seem overwhelming and some of it is more supplemental, so let’s pull out the relevant points:
1) In nominal terms, margin borrowing in January ($364 Billion) was the third highest reading on record, closely trailing June ($378 Billion) and July ($381 Billion) 2007.
2) Also in nominal terms, the amount of cash and margin credit available vis-a-vis margin debt is at its second lowest since 2000 (lowest: June 2007 at -$79.02 Billion) at -77.22 Billion.
Here’s the breakdown of the relevant data (source: NYSEData Factbook):
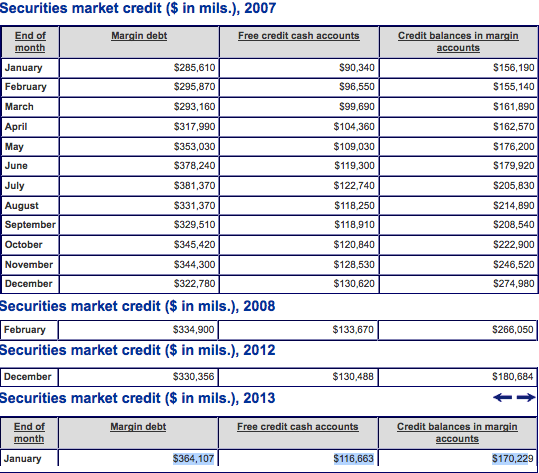
June and July 2007 were significant months for their multi-year and all-time highs; all the more so because these developments preceded the last market top by 3-4 months.
There’s nothing magical about $350-$400 Billion. In fact, if you slap a CPI-deflator on the NYSE Margin Debt series as Doug Short did, you’ll note today’s value is equivalent to the the 2000 top and still well-shy of 2007’s.
Nominal or Real though, the current level is near-record. As a sentiment indicator, the willingness of retail and institutional alike to borrow reflects a heavily-tilted sense of confidence.
More instructive on this point (and the more incisive measure overall) is the debt-to-cash/credit spread. Right now entities (persons, firms, etc.) are willing to borrow to purchase stock long; and that is indicative of their confidence (and foolhardiness at extreme levels). But if they’re flush with reserves sufficient to offset/buffer their debt, the gross debt figure is less relevant: these entities have a positive net worth in this scenario: their tolerance of adverse moves is high, their capacity to sustain losses and avert calls substantial.
That isn’t the case right now (data as of the end of January), however. Margin holders are highly extended with a nominal spread between their debt and cash/credit of -$77.22 Billion. In practical terms, they have very low “adversity tolerance” – their capacity to weather significant incursions against their long positions is threadbare.
Also, consider these supplemental points:
First: as Bloomberg reports, short sales fell in February to the lowest level since recording began 6 years ago, including 2007. This is one sign of bearish capitulation and a proximate signal of a market top.
And Second: this margin debt isn’t being taken on only by those commonly-conceived of as suckers: Hedge funds ratcheted up their performance chase in January 2013, increasing gross leverage to 153%, the highest since at least 2004 and well above the average since 2005 of 143%.
High Margin Debt, low adversity tolerance, low short sales, higher Hedge Fund leverage: these aren’t characteristics signaling a top (correction or cyclical top) is in store next week: but they are features that push a mature bull market to its culminating point.
Against this backdrop there is a widespread and somewhat vain reliance on retail investor euphoria as a precursor to a major correction or bear market; in reality, this is more a function of lack of familiarity with market history and the recency effect. The return of the individual – a bit like chaining Andromeda to the rock by the sea to mitigate Poseidon’s wrath – as the necessary precondition for the excess that marks the terminus of a rally is not inevitable and certainly not an immutable law of market sentiment analysis.
So, do Dow Jones all time highs and this crossing into uncharted territory mean anything? It will surely be a boon to market sentiment. It will be reassuring enough to some to get back in, prompting others to enter or add to their portfolio and positions for fear of later feeling the regret of missing out. Still others will decide all the headlines mean the meat of this bull is finally done and will protect gains by taking some off the table and/or moving their stops (the maximum loss they’ll tolerate) higher to lock in more of what this remarkable uptrend has produced.
Amidst this, our base thesis assumes the primary trend of the 4-year bull will continue. However, that thesis grows tenuous, given the technically compelling reasons we mentioned recently to suppose $SPX 1540-1580 will be a difficult level to surmount.
There are scenarios suggesting a range of outcomes from this window, from relatively mild correction to -20%+ bear market, just as there are those that plot a rally above this level into the S&Ps own all-time highs. Even for an open, liquid market, the current array of price, time and sentiment variables add up to a highly dynamic environment. From here, opinions can change in a moment; but until proven otherwise, the Dow Jones all time highs are yet more rungs in the ladder of a long trend that continues to point higher.
Twitter: @andrewunknown and @seeitmarket
No position in any of the mentioned securities at the time of publication.
Any opinions expressed herein are solely those of the author, and do not in any way represent the views or opinions of any other person or entity.

: Worrisome to Broader Market?")
