This post was written by Craig Basinger and Derek Benedet of Richardson GMP.
Behavioral Finance combines behavioral and cognitive psychology theory with conventional economics and finance. Essentially it attempts to account or add the “human” element into understanding how the markets behave. While still a relative new area, it has garnered a great amount of attention. The most common aspects of this discipline are behavioral biases, such as loss aversion, framing, overconfidence, anchoring, recency, overreaction, etc. Many publications are devoted to helping investors understanding these biases to avoid their negative impact on performance.
At Connected Wealth we are taking this one step further. The team is currently researching not only the various biases in the real world but working on investment strategies that take advantage of these biases. In the coming months we will be publishing on various aspects of this work and we welcome any feedback.
Company share prices often materially react to earnings results, and for good reason. Earnings are perhaps the best window into how a company is operating and surprises one way or the other often leads to considerable trading volumes and price action. This leads to a couple questions from a behavioral finance perspective. 1) If a company’s worth is the present value of its cash flows over many years to come, does missing by a nickel or dime really matter that much? 2) When a company misses or surprises to the upside, does the market overreact in the short term. In today’s report we will tackle the short-term aspect, does the market suffer from an overreaction bias from earnings results.
The Analysis
For the TSX 60, we included all earnings results over the past eight years. We measured the price reaction on the day of earnings, or the next day if a company reported after the close. We also measured the performance over the next week, two weeks and month. All performance measures in this report are relative to the market to avoid the influence of big moves in the market. As we had little interest in instances when the share price does not react much to earnings, we focused on bigger earnings reactions. The threshold for these bigger reactions was a function of the company’s historical volatility.
The Results
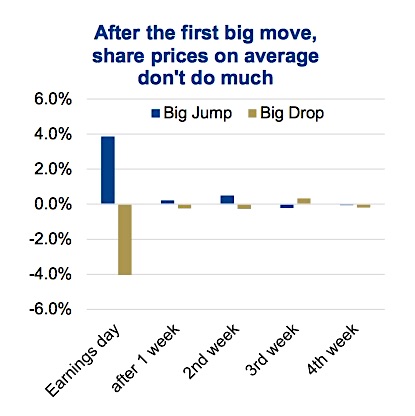
It would seem, that on average, the market does get it fairly right on the 1st day of trading after earnings. The chart at the top of page 1 shows the average relative performance on positive and negative big jump instances, followed by any incremental moves. The average performance certainly does not support any overreaction in the market to earnings. In fact, there may be a very minor under reaction looking at the subsequent small blue and beige bars in week 1 and 2.
As you can hide a lot of information in “average performance” numbers, we also looked at the number of instances or occurrences and the probability of a subsequent positive or negative performance. This was roughly 50/50, again supporting the view that after the first big reaction to earnings, the market seems to get it right, on average.
Volatility Matters
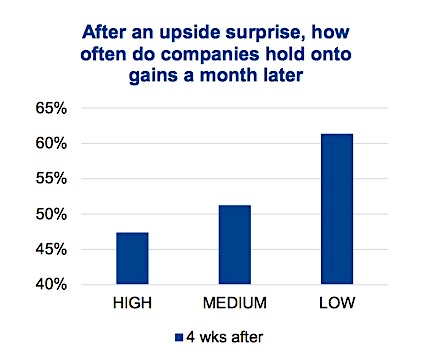
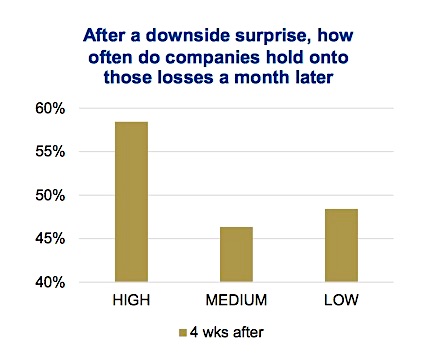
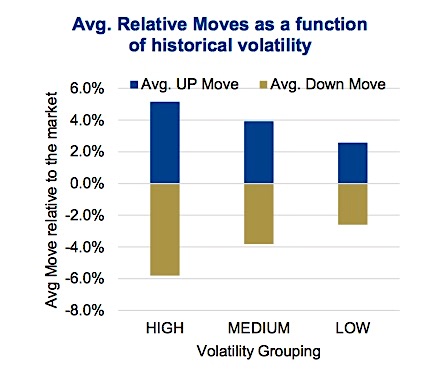
While the aggregate results were not very insightful, digging deeper we did uncover some interesting relationships. The degree of historical price volatility of the company appears to have a relationship with market reaction to an earnings surprise or disappointment. Specifically, after a positive surprise companies with historically lower volatility hold onto their gains or even extend the gains much more reliably while companies with higher volatility more often give back their gains. The relationship also held similarly after big downside surprises. After the drop, lower volatile companies regained some of the lost ground more often compared to higher volatile companies. The takeaway would be to fade a positive surprise or sell the positive move for higher volatile or riskier companies. For those lower quality or more volatile companies a negative surprise should not be viewed as a buying opportunity. Conversely, lower volatile companies are better at extending positive surprises and are better recouping losses after a disappointment.
Not surprising, companies with higher historical volatility also saw bigger reactions to earnings surprise and disappointments. The top chart on this page shows the average reaction, both good and bad, as a function of company volatility grouping.
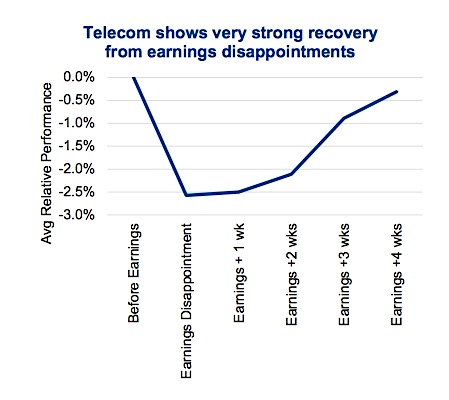
Defense Bounced Back from Disappointment
One of the more interesting findings was in higher quality or defensive sectors. Specifically, Utilities and Telecommunication Services, two sectors often viewed as higher quality or safer, appear to bounce back nicely from earnings disappointments. This was most evident for telcos. They also tend to hold onto gains after a positive surprise. The takeaway would be to take a look at companies in these sectors should they miss the mark during earnings and sell- off. These are often buying opportunities.
This recovery pattern did not hold for most other sectors. After big disappointments Energy, Materials and Consumer Discretionary continue to suffer further losses on average.
Next steps – we will apply similar research to the U.S. market. And extend the analysis period beyond a month. Stay tuned!
Thanks for reading.
Charts are sourced to Bloomberg unless otherwise noted.
Twitter: @sobata416 @ConnectedWealth
Any opinions expressed herein are solely those of the authors, and do not in any way represent the views or opinions of any other person or entity.


