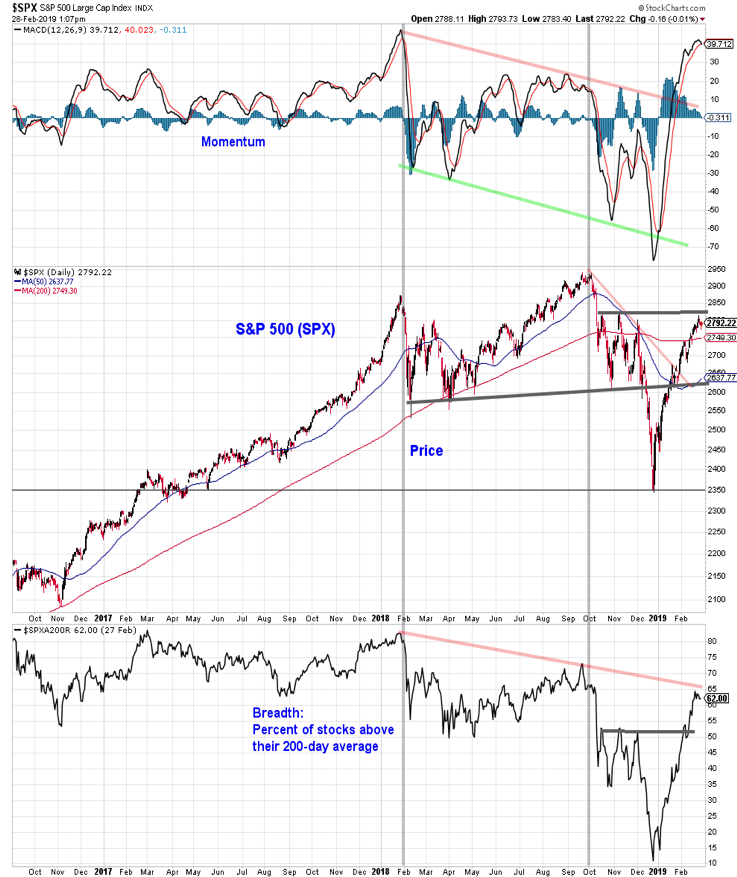
U.S. Stock Market – Key Takeaways: The broader stock market as represented by the S&P 500 is contending with resistance from both a price and market breadth perspective as momentum has begun to stall.
Investor sentiment indicators show a collapse in the fear that was present at end of 2018, though excessive optimism not yet widespread. Longer-term breadth trends remain mixed.
The S&P 500 is again testing resistance near 2800, its fourth attempt at this level since originally breaking below it in October.
While improving momentum has fueled the rally off of the late-December lows, it is now starting to roll over. To some degree breadth has seen more significant improvement than price this year – the percentage of S&P 500 stocks trading above their 200-averages has already eclipsed the level that represented resistance in October and November (when the S&P 500 last tested the 2800 level).
However, the longer-term pattern off high remains intact from a breadth perspective. Getting this indicator above 65% would be evidence of improvement.
With momentum stalling, resistance holding for now, and sentiment indicators showing less fear and more optimism, the 2019 rally could face its most meaningful test to date. If so, look for support near 2740 and again at 2640.
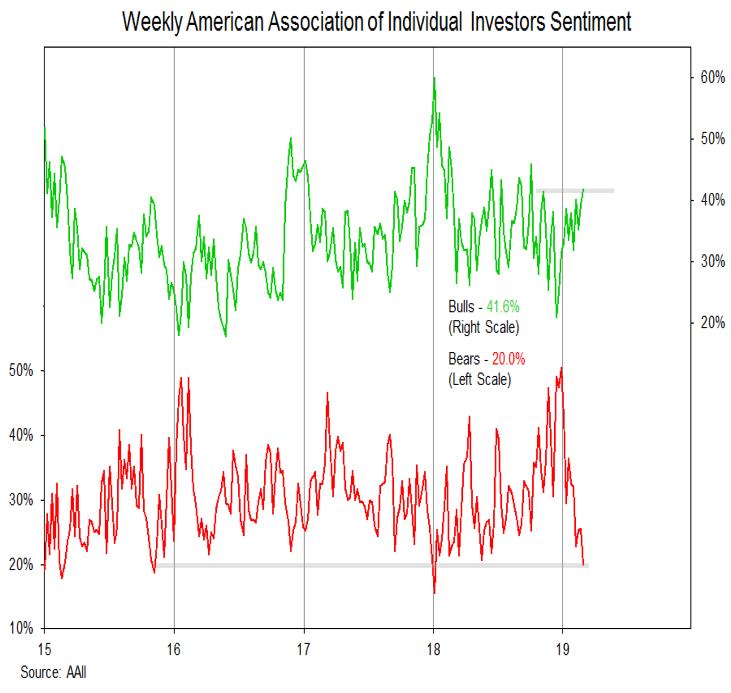
Bears on the AAII survey moved from one extreme to another over the course of 2018. The January low of 15.6 was the lowest level since November 2014 and the December peak at 50.3 was the highest level since April 2013. Bears have steadily declined in 2019 and this week moved to their lowest level since January of last year (and their second lowest level in more than three years).
While fear appears to have left the building, optimism has not yet re-emerged on this survey. AAII bulls have climbed from a late 2018 low of 20.9% to 41.6% this week, but are shy of the 59.8% reading seen in January of last year.
Beyond a narrow focus on the AAII data, there is evidence of that optimism is becoming excessive. The 10-day CBOE put/call ratio has moved to its lowest level since September and the Investors Intelligence bull-bear spread has risen to 32%.
Both the NDR Trading Sentiment Composite and the Crowd Sentiment Poll point to a significant shift since late 2018 from extreme pessimism to extreme optimism. While fear and pessimism were present to fuel the gains off of the December lows, that fuel is largely spent. These sentiment composites suggest that risks have risen and further near-term gains could be hard fought.
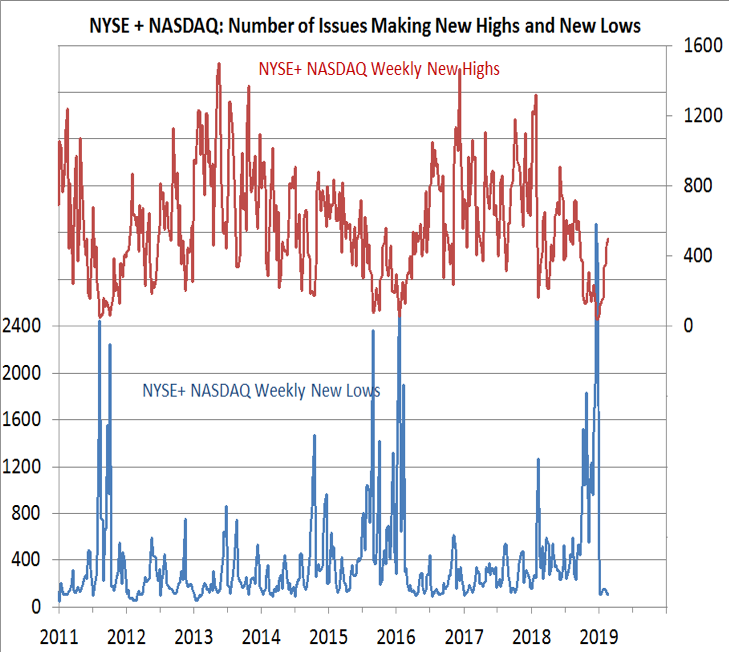
One caveat to the shifting sentiment data is the improving broad market backdrop that has accompanied the rally. We have tried to highlight breadth thrusts as they have emerged, and these could provide a bullish tailwind for stocks over the course of 2019. Another positive breadth development is the expansion in the new high list. The S&P 500 has seen nine consecutive weekly gains, the last eight of those have come with a rising number of new highs on the NYSE + NASDAQ.
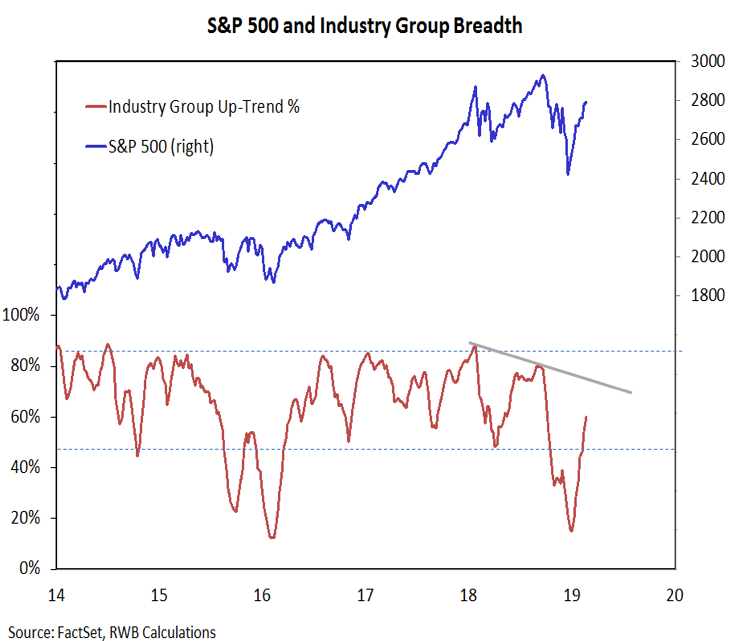
As strong as the near-term breadth backdrop has been, there are still longer-term pockets of concern. On the first page, we highlighted the still intact down-trend in the percentage of stocks trading above their 200-day averages. Similarly, our industry group trend indicators, while improving since late December, has not violated the pattern of lower highs and lower lows that emerged in 2018.
Another way to think about this is that coming into this week, 74 of 75 industry groups were trading above their 10-week averages, but only 9 of 75 have 10-week averages above their 40-week averages.
Twitter: @WillieDelwiche
Any opinions expressed herein are solely those of the author, and do not in any way represent the views or opinions of any other person or entity.


