S&P 500 Ticks Higher, but Market Risks Loom
Stocks continue to show strength in the face of bearish market cycle forces. Last week saw another hiccup, but bears couldn’t capitalize on the pullback. Let’s see what this week holds.
Stock Market Summary and Weekly Cycle Forecast:
The S&P 500 (NYSEARCA:SPY) moved higher last week, rising by 0.5%.
Stocks climbed higher as the economy showed continued strength in the form of job creation, with multiple sources reporting strong figures.
Our analysis for the stock market is for a decline early in the week following by an attempted rally as a new short-term cycle begins.
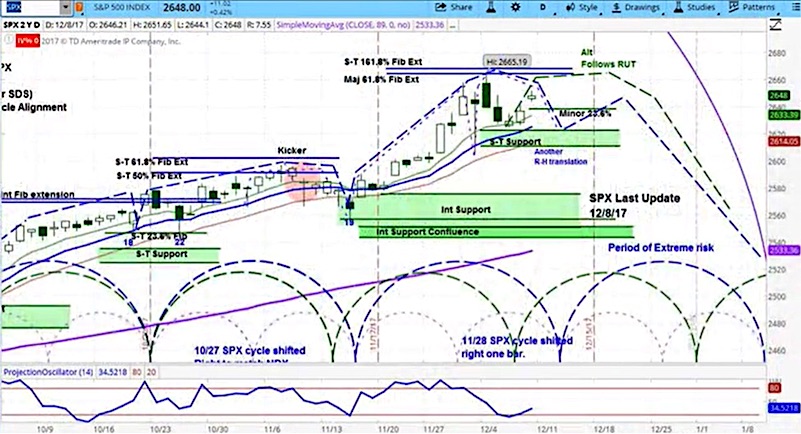
The stock market moved higher last week, with the S&P 500 (SPX) moving up 13 points to 2655, a new record closing high.
On Monday, stocks opened higher but later reversed. This was led by the technology sector, who would have benefit less from the Senate version of the tax bill approved on last Friday. This version includes a 14% tax on earnings held in overseas accounts, whereas the House version is 8.5%. On Tuesday, tech stocks picked-up steam again but the overall market closed lower.
On Wednesday, payroll processor Automatic Data Processing (ADP) estimated November job creation at 190,000 versus estimates of 175,000. The strong job report indicates the economy continues to show strength and helped push stocks higher for the day. On Thursday, investor expectations ticked down with regard to growth in China, especially in the property market. This manifested in lower prices for metals, such as copper and nickel.
Early Friday morning, British Prime Minister Theresa May reached an agreement with the European Union that will move the Brexit negotiations forward. In the US, The Bureau of Labor Statistics (BLS) reported an increase of 228,000 jobs for November, but on average the economy created 13,000 fewer jobs per month for 2017 versus 2016.
The SPX chart above shows our projection for the coming week: a decline early in the week following by an attempted rally as a new short-term cycle begins. Stock market risk will continue to increase as the end of an intermediate term cycle approaches in early January. The blue-dotted half circles at the bottom of the chart illustrate the short-term cycle patterns for the SPX. The green-dotted half circles represent the Russell 2000 (RUT).
For a more detailed look at cycle analysis for a broader selection of futures, watch the askSlim Market Week every Friday afternoon.
Here’s the latest askSlim Market Week Video:
Twitter: @askslim
Any opinions expressed herein are solely those of the author, and do not in any way represent the views or opinions of any other person or entity.

 Testing Important Price Support")
: Cup (and Maybe Handle) Watch")

