The S&P 500 (INDEXSP:.INX) has snapped back after declining about 1.5% in the final 5 days of the year. But it will need to make up some ground to expect smooth sailing in the days ahead.
A sharp advance in stock market futures this morning created a gap higher on the cash markets. Stocks will need to show more strength to offset recent weakness.
S&P 500 Technical Analysis & Market Thoughts
Key price areas to watch on the S&P 500 start near 2262 up to 2268 on the upside (resistance) and 2237 to 2240 on the downside (support). Treasuries were very weak this morning but are recovering. As well, the US dollar touched over 104 before retreating.
My current concern for equities is down momentum (despite a sharply HIGHER opening gap to start the year). Investors need to see a bit more upside before believing in this rally.
You can also watch my technical video highlighting the 3 most important charts for today.
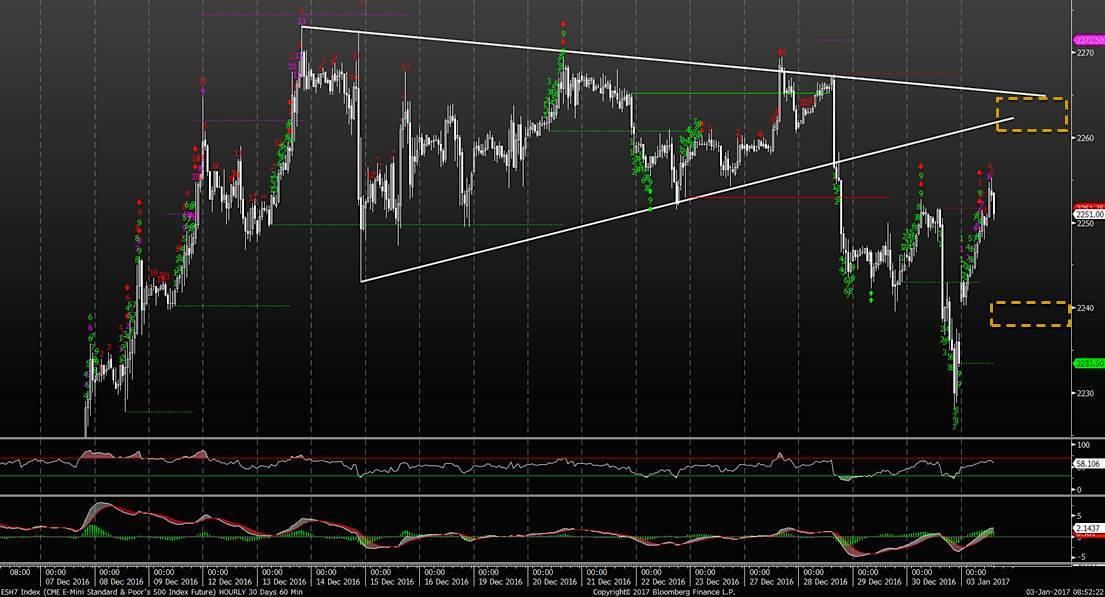
S&P 500 – Hourly Chart
The chart below is showing the price action since mid-December. Overall the trend turned negative with a break down under 2256 and then 2251. Although this came on low volume, traders need to respect the price action. Overall, this move to the upside should find strong resistance at 2262 up to 2268. A move OVER this level would create a bullish case for a broader rally into mid-month.
Thanks for reading.
Note that you can catch more trading ideas and market insights over at Newton Advisor. Thanks for reading.
Twitter: @MarkNewtonCMT
Any opinions expressed herein are solely those of the author, and do not in any way represent the views or opinions of any other person or entity.


 Flirting With Critical Support… Again")