The U.S. stock market indexes continue to ignore persistent worries. However, the S&P 500 (NYSEARCA:SPY) looks like its ready to pullback this week.
News from emerging markets may finally catch up.
S&P 500 Cycle Outlook for the Week of September 3, 2018:
– The stock market rose last week, with the S&P 500 (SPX) up 27 points to a new high of 2902, a rise of 0.9%.
– The market was influenced by progress on the NAFTA negotiations as well as a red hot Amazon.
– Our projection this week is for SPX to decline to our support zone between 2860-2873.
On Monday, President Trump announced the “US-Mexico Trade Agreement,” which he said would help American farmers and manufacturers. This development may have accounted in part for the move higher in the stock market, which produced a new all time high.
The next stage in the trade talks is to bring Canada back into the negotiations. Trump remarked that the US might withdraw from NAFTA, if the talks with Canada did not meet expectations. Yet it is unclear if Congress would approve such a move.
With a possible resolution to NAFTA in sight, White House sources indicated that as soon as next week Trump may impose $200 billion in new tariffs on Chinese imports. Stocks declined towards to the end of the week on this news.
On Wednesday, Morgan Stanley increased its price target on Amazon (AMZN) from $1850 to $2500, which is now the highest target amongst Wall Street analysts. The stock responded positively, adding over 5% on the week, making a new all time high.
Amazon (AMZN) Stock Chart with Weekly Bars
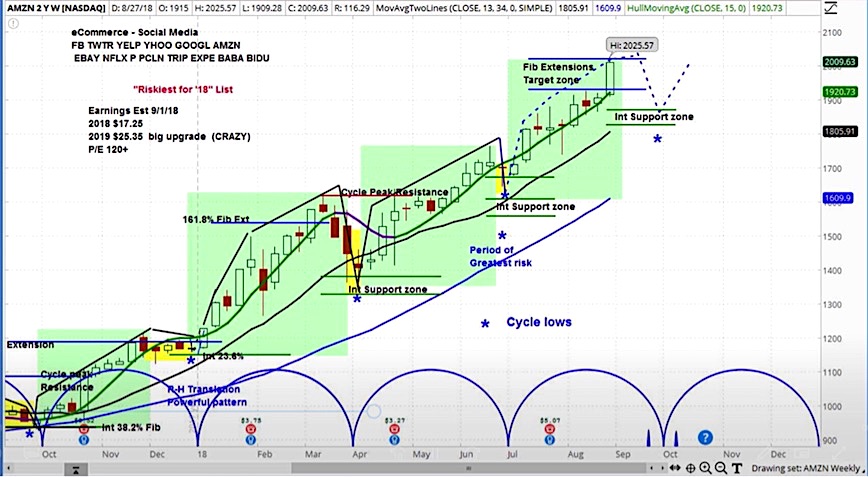
Our approach to technical analysis uses market cycles to project price action. For AMZN, we can see that it is still in the rising phase of its current cycle. However, with a sky-high valuation and a cycle due to end in early October, we believe that the stock may be ready for a correction. As we discuss in this week’s Market Week show, our near-term target is below $1900.
Turning to emerging markets, the Turkish lira lost 9% on the week, the Indian rupee lost 2%, and the Indonesian rupiah lost 1%. We could see more volatility, with Turkish inflation data due early this week, which could point to an annual rate of more than 17%.
S&P 500 (SPX) Daily Chart
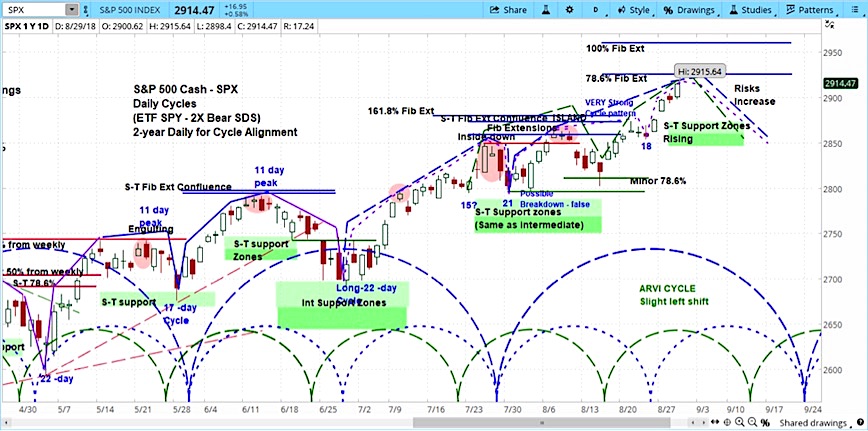
Our analysis of the S&P 500 is that it has likely begun the declining phase of its current market cycle. This is within the context of a market that has been experiencing rock solid bullish momentum since July. Nonetheless, we expect for the downside action we saw at the end of last week to continue into our support zone of 2860-2873.
Twitter: @askslim
Any opinions expressed herein are solely those of the author, and do not in any way represent the views or opinions of any other person or entity.


 Trading Into Inflection Point")
