If you are new to the blog, we all like to write about the macro picture using what I call the Economic Modern Family.
This “Family” is comprised of one index, the Russell 2000(NYSEARCA: IWM), and five sectors: Retail(NYSEARCA: XRT), Biotechnology(NASDAQ: IBB), Regional Banks(NYSEARCA: KRE), Semiconductors(NYSEARCA: SMH) and Transportation (NYSEARCA: IYT).
We have a full description on our website of why I chose those instruments and how reliable they are as indicators for gauging market direction.
I would like to thank Geoff and Keith for filling in for me while I was busy in New York receiving an award for the “Best Stock Tip of 2018” from RealVision.
One aspect of measuring the reliability is when all the members of the Family are trading in the same direction and are in the same phase.
Currently, all the Modern Family instruments are in Bearish phases.
Why then, would I highlight Biotechnology IBB today, above all the others?
Before I left for NY, I featured the Transportation sector.
As an extremely important factor in the U.S economic outlook, IYT, extremely oversold, might have some bounce if can hold over 169.45, the mid-November 2017 swing low.
Yet, Biotechnology from a chart standpoint, is super interesting.
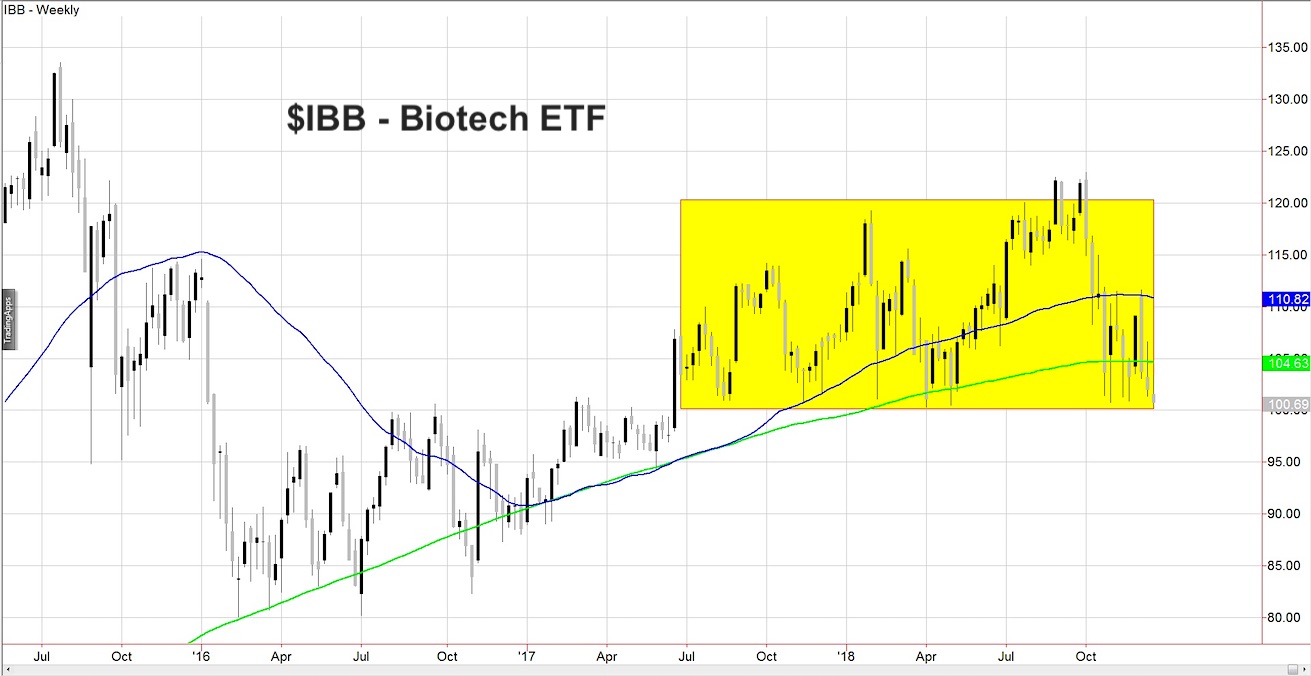
Until today, the 2018 low in IBB was made at 100.22 in April.
Today’s low is 99.39.
When you look at the weekly timeframe chart, I placed a box around the price action going back from June 2017 until the present.
A few observations.
First, IBB is trading below both the 50 and 200-week moving averages.
Secondly, while the Dow made new highs this year, IBB never cleared the 2015 highs.
That alone is interesting. Why?
This sector is highly speculated. In fact, IBB is one of the most speculated because of its volatility and the opportunity to make a big score if you are on the right side of an FDA trial approval or not.
With its failure to launch to new highs this year, that means that in hindsight, this whole bull market run earlier in the year was suspect.
For those who have followed this sector as long as I have, IBB was the first to rally back in 2009, after the 2008 crash.
Therefore, that box is really important to watch.
By late day, IBB retook the 100 area for a 6thtime. That could bring back some buying interest. That would put 103 in focus as resistance to clear.
If IBB fails to hold 100, I’d prepare for another leg lower with next support at 97.90.
S&P 500 (SPY) – The 2018 low is 252.92 made in February. Did not get there today. Bullish, right? LOL. All depends now on its bounce power. 261.50 point to clear
Russell 2000 (IWM) – A lot of support around 134.50-135. Let’s see if this can back above 140
Dow Jones Industrials (DIA) – 233.20 the 2018 low made in April. 246.25 resistance
Nasdaq (QQQ) – 150.13 the 2018 low. That’s quite a distance away. Tell me, if holds 157.40 area, could see a mov back to 164 first.
KRE (Regional Banks) – 50.15 key resistance which if clears is a healthier sign
SMH (Semiconductors) – 90.00 pivotal with 86.95 recent low
IYT (Transportation) – Like to see this get back over 169.45
XRT (Retail) – Broke the 80-month MA, first time since 2010.42.38 is the point to clear back above
Twitter: @marketminute
The authors may have a position in the mentioned securities at the time of publication. Any opinions expressed herein are solely those of the author, and do not in any way represent the views or opinions of any other person or entity.


: Showing Some Signs of Emerging Strength")
