 That’s always the follow up question, isn’t it?
Earlier we considered how far small caps might go after bears succeeded in tripping the thirteenth 50-Day SMA trap of the last year. If the past 12 months are any guide, small cap benchmark index Russell 2000 could rally another 2.3% (in line with the last year’s average according to that study) or even as much as 8.2% (duplicating February’s rally in a measured move up) before having the next material dip.
The hyper-methodical, low-amplitude ebb-and-flow (mostly flow) of this up-trend will surely end; and like others, I have principled technical reasons to believe the idyll that was last year will not repeat in this one. Still, those reasons, theses and arguments are subservient to the prevailing trend: and we all know which way that points. In the interest of staying on the right side of that here’s another, complementary look at the Russell 2000.
In this simple study, the Russell 2000 Mini Futures (ICEUSA: TF) are broken out 8 pullbacks (including the current one), each of which is expressed by 1 of 3 classical technical formations: 1) descending broadening wedge; 2) broadening formation (or megaphone); and 3) Flag (or Rectangle). As the chart describes in greater detail, each of these patterns includes a higher high in the trend that gives way to a pullback. In the past 7 instances, the next leg up of the rally occurs when these patterns break out higher and advance to the 127.2%, 161.8% or 200% extension of the pullback’s range:
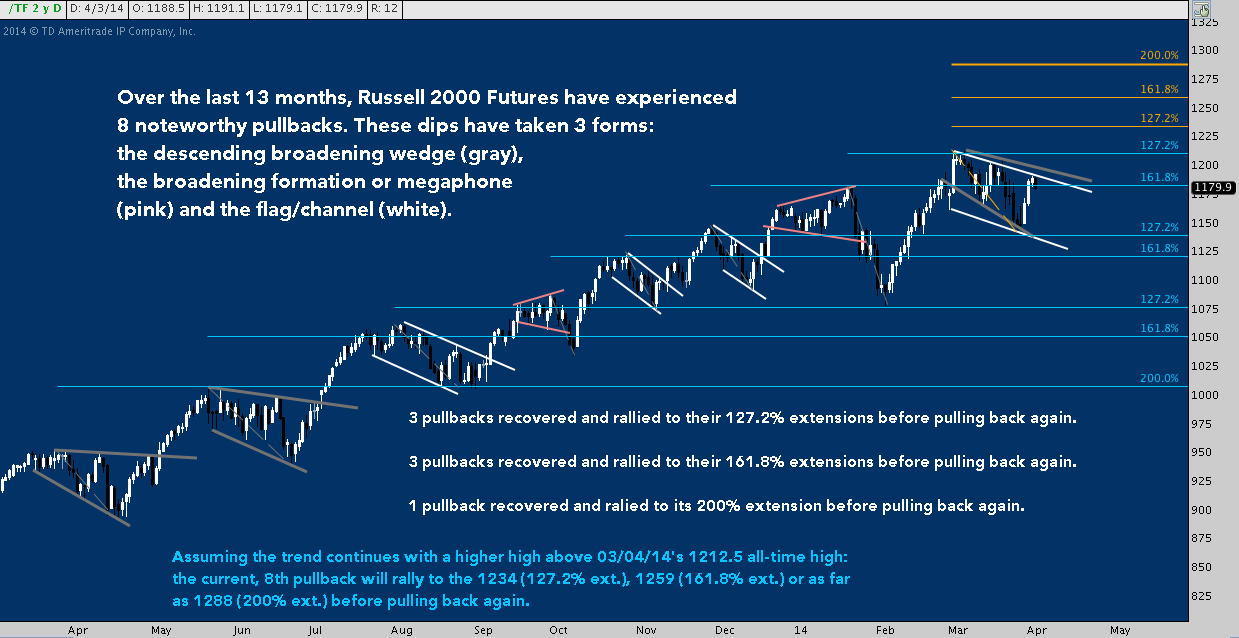
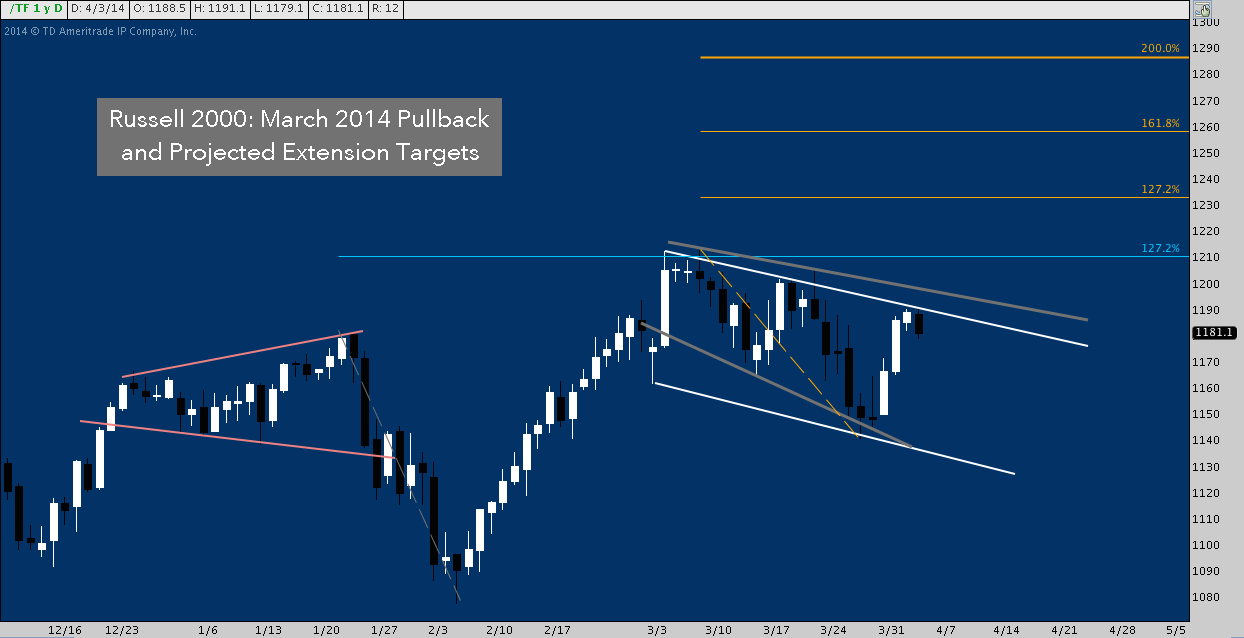
With extension targets of 1235 (+4.6%), 1259 (+6.7%) and 1288 (+9.2%) projected above, the next chart is a closer look at the eighth and current pullback. R2k is near flag (or alternatively, the descending broadening wedge in gray) resistance, so this dip hasn’t yet been set down in the permanent record. Under the base up-trend scenario (as I said earlier, there are other, more pessimistic outcomes to think about also), the index must advance above it’s 03/04/2014 year-to-date (and all-time) high at 1212.50 to make the continuation thesis credible. Once that happens, these are the upside levels to monitor: both as objectives and as potential reversal points from which the next pullback cycle will begin.
Twitter: @andrewunknown and @seeitmarket
Author carries net short Russell 2000 exposure at time of publication. Commentary provided is for educational purposes only and in no way constitutes trading or investment advice.
Charts courtesy ThinkorSwim/TDAmeritrade
Any opinions expressed herein are solely those of the author, and do not in any way represent the views or opinions of any other person or entity.


