Given the ongoing spread of the Coronavirus, nobody should be surprised to see the selling that came into the stock market today.
Over the weekend, we reviewed some of the early warning signs the stock market had already signaled.
For example, junk bonds and regional bank stocks sold off. Interest rate yields fell sharply, and gold had a sizeable rally.
The focus coming into today however, was the Russell 2000 ETF (IWM) which is our “Granddad of the Economic Modern Family”.
But before we get into the analysis and what we might expect next, I’d like to share with you a question I received about the Economic Modern Family and how it measures market breadth.
The basis of the Family is to gauge the key cyclicals and non-cyclicals of the US economy.

Each member serves a distinct role in helping us determine these key cycles. Yet, it’s the phases that help us see easily, the aggregate of the stock market’s breadth.
Once Regional Banks ETF (KRE), deteriorated in phase, that threw up a red flag.
From there, we prepared for a diminishing overall market breadth.
Lo and behold, 4 more Family members saw deteriorating phases.
The brick and mortar Retail Sector ETF (XRT), Big Brother Biotechnology Sector (IBB) and Transportation (IYT) not only broke their 50-DMAs, but did so with a significant gap down.
Interestingly, Grandpa Russell held the 50-DMA until the final minutes of the trading day. Hence, he broke the 50-DMA and the bullish phase, but only marginally so.
The illustration depicts the 6 arrows to the body the market endured.
Yet with his sword help up high, it may not necessarily have been the lethal blow.
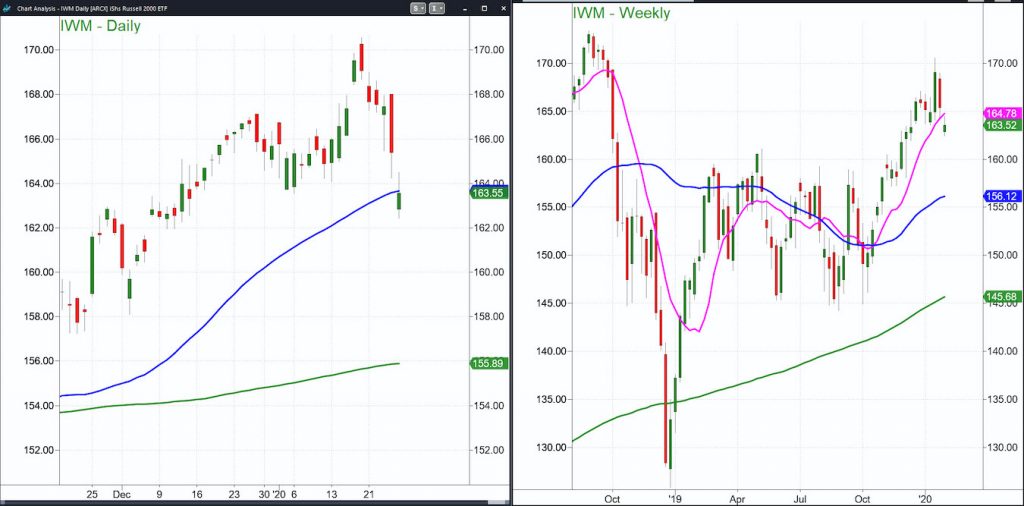
Here are the weekly and daily charts of the Russell 2000 IWM.
Though we broke the inside week pattern we came into today with, IWM only slightly broke the 50-DMA.
As 164.07 was the low the week ending January 17th, that now becomes a key pivotal area.
Moreover, IWM must clear/hold the 50-daily moving average or 163.67.
This support between 163.67-164.07 becomes critical for this entire week.
Even if it breaks down under there moreso tomorrow or Wednesday, where IWM closes out the week and the month should set the stage for the bigger move that happens thereafter.
The breadth of the Economic Modern Family phases, should all including Sister Semiconductors SMH remain in caution phases, will lead to a bigger down move.
Then, we will see if the bulls live to fight another day.
If IWM can pull out his sword and strike back at the bears, then with earnings season in full swing, this correction could also become a very welcomed buy opportunity.
Tuesday at 5 PM ET, I am offering a live training session on Identifying The Stocks & Market Sectors That Will Provide You With Hugely Profitable Trades: https://marketgauge.lpages.co/mmma-20200128-push/
S&P 500 (SPY) A weekly close under 320 will not look healthy. So that is the area to hold.
Russell 2000 (IWM) Support between 163.67-164.07 to hold.
Dow Jones Industrials (DIA) 283.93 is the 50-DMA.
Nasdaq (QQQ) A weekly close under 212.24 will not look healthy. So that is the area to hold.
KRE (Regional Banks) 54.00 is the 200-DMA.
SMH (Semiconductors) A weekly close under 139.77 will not look healthy. So that is the area to hold.
IYT (Transportation) 190 next support. 195.50 resistance.
IBB (Biotechnology) Confirmed caution phase with 115.40 support.
XRT (Retail) Confirmed caution phase with 43 support.
Twitter: @marketminute
The author may have a position in the mentioned securities at the time of publication. Any opinions expressed herein are solely those of the author, and do not in any way represent the views or opinions of any other person or entity.


