Vikky Alexander “is fascinated by spaces that are saturated with extreme beauty and total artifice.”
Phantasmic means unreal and illusory. In this installation, mirrored pillars stand before projected images.
The mirror’s multiple surfaces fracture the perspective. The result is to expose and defy any comprehension of the whole. So how does this relate to the stock market?
In stock market terms, one could argue that the last 4-years, except for the brief trip to stark reality at the end of 2018, have been a thing of beauty and a total artifice.
Nowhere is the contrast better represented than what we have witnessed in our core stock market ETFs (the economic Modern Family).
While the S&P 500 ETF (SPY) and NASDAQ 100 ETF (QQQ) have enjoyed multiple new all-time highs over and over with the last one made just a week ago, the Russell 2000 ETF (IWM) has struggled and failed to get to its all-time high from 2018.

In fact, the case for a giant double top in the Russell 2000 now grows stronger.
For the sake of repetition, artificially low interest rates, low corporate tax rates, the elimination of many regulations to corporations’ advantage, corporate buybacks, and yes, a real tech boom, all are the reasons the stock market has enjoyed huge gains.
Furthermore, the “inflation metric” used by central banks is the ultimate phantasm.
Put the aforementioned together along with soaring debt, geopolitical strife and now, this unfortunate pandemic, and Alexander’s installation reflects and re-reflects the defiance of any comprehension of the whole.
Looking at the weekly charts, will the stock market’s mirrored pillars reflect reality or hallucinations?
Before we dissect these charts, it is important to note that the Russell 2000 ETF (IWM) confirmed the caution phase, the Dow Jones Industrial Average ETF (DIA) went into an unconfirmed caution phase, while the S&P 500 ETF (SPY) touched down yet held the 50-DMA.
The Nasdaq 100 ETF (QQQ) is not even close.
Looking at the weekly chart of IWM, the bear flag breakdown I wrote about all this past week with a projected move to 160, worked perfectly.
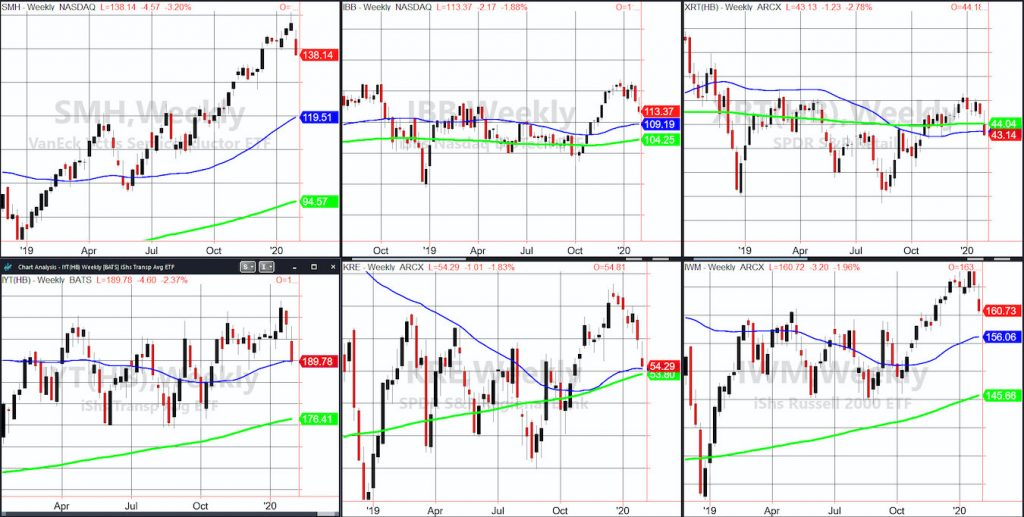
The Semiconductors ETF (SMH), the superstar, also went into an unconfirmed caution phase on the daily charts.
On the weekly, SMH landed right on a weekly exponential moving average. Whether it holds or not at 136 is a focus for this week.
Biotechnology (IBB) approached and sits on its 50-WMA. If this is where specs live, then one can assume there is a lot more liquidation yet to happen.
Brick and Mortar Retail XRT, unsurprisingly failed the 50 and 200-WMAs. Put that together with the key areas that SMH and IBB are still holding, then XRT has a shot to rally. Only though, if SMH and IBB hang in there.
Transportation landed right on its 50-WMA. What happens next should it hold or not becomes obvious.
Regional Banks-the Prodigal Son, who right on cue started this sell-off, also landed right on the 50-WMA. Again, that makes it obvious as to what happens next.
The Russell 2000 IWM has room to its 50-WMA and 200-DMA at 156.
Let’s put it this way, caution phases are just that-a reason to exercise caution.
However, a distribution phase should conditions worsen, will reflect real and not phantasmic fear.
“The mirror is an instrument that not only reflects the real but also reflects the hallucinations of the ideal world that we position before it.” Ian Wallace
Plant Your Money Tree made it to the Best Wealth Books of All Time
I’m happy to announce that my book, “Plant Your Money Tree: A Guide to Growing Your Wealth”, made it to BookAuthority’s Best Wealth Books of All Time:
BookAuthority collects and ranks the best books in the world, and it is a great honor to get this kind of recognition. Thank you for all your support!
The book is available for purchase on Amazon.
S&P 500 (SPY) 320.70 the 50-DMA. 324.00 resistance
Russell 2000 (IWM) 160 support then 156-162 then 164 resistance
Dow (DIA) 284.50 is the 50-DMA resistance and support 281.40
Nasdaq (QQQ) 212.35 support with 222.10 resistance
KRE (Regional Banks) 53.80 the 200 WMA and 54.00 is the 200-DMA.
SMH (Semiconductors) 139.85 50-DMA resistance. 136 key support
IYT (Transportation) Unconfirmed distribution phase as this sits right below the 200 DMA and 50-WMA making 189.71 super pivotal
IBB (Biotechnology) 111 support 118 resistance
XRT (Retail) 43 support at the 200-DMA so right there
Volatility Index (VXX) Unconfirmed Recuperation phase
Twitter: @marketminute
The author may have a position in the mentioned securities at the time of publication. Any opinions expressed herein are solely those of the author, and do not in any way represent the views or opinions of any other person or entity.

 Flirting With Critical Support… Again")


