THE BIG PICTURE
The major stock market indexes remain uptrends. And although we are overdue for a pullback, the best thing to do is follow the price action and avoid anticipation due to “noise”. If/When we enter a market pullback, your process should stop you out of the trade… or offer new looks on both sides (long & short).
Without further adieu, here’s my weekly futures trading update and outlook. We’ll start with the S&P 500 (INDEXSP:.INX).
S&P 500 Futures (ES) – Week 40 (week of October 2)
A Note On Using MML Charts: Using the Murray Math Level (MML) charts on higher time frames can be a useful market internal tool as price action moves among fractal levels from hourly to weekly charts. Confluence of levels may be levels of support/resistance or opportunities for a breakout move. Optimal setups will pass through Resistance or Support prior to moving in the opposite trend.
Technical Trends…
- Check out my week 39 recap and trend charts
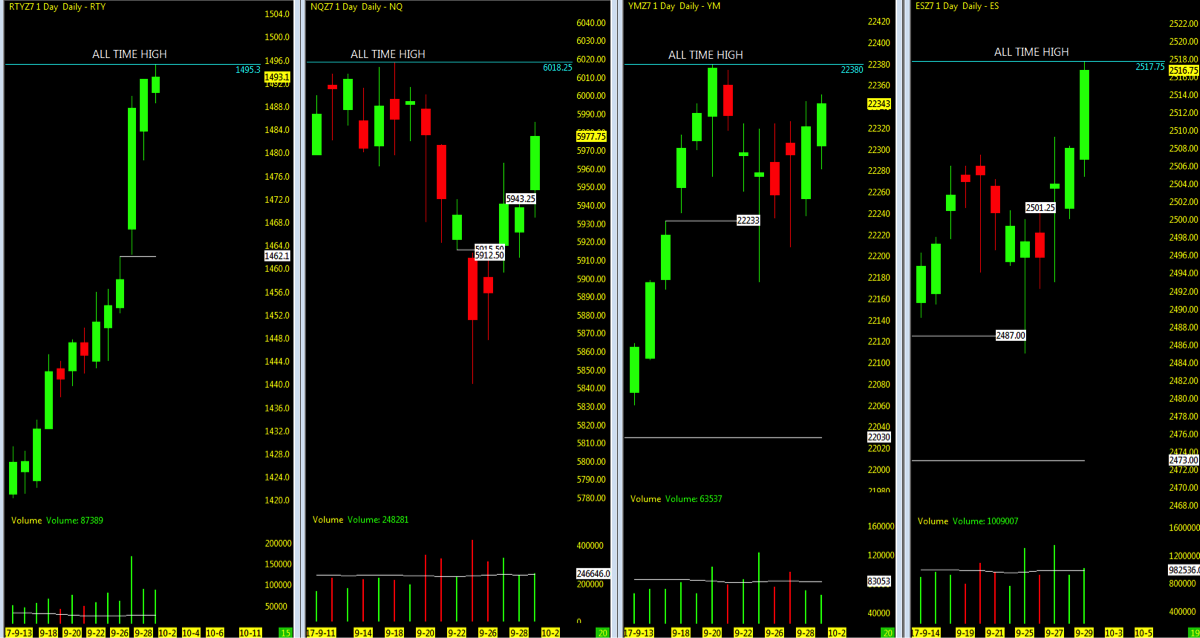
- Stock market indexes momentum closes back above the weekly open making new all time highs on the Russell 2000 (INDEXRUSSELL:RUT) and S&P 500.
- Russell 2000 small caps lead momentum drive upside
- VIX Volatility Index (INDEXCBOE:VIX) levels holding in mid 9’s
- Short interest on FAAMG stocks building with AMZN under the 50ma
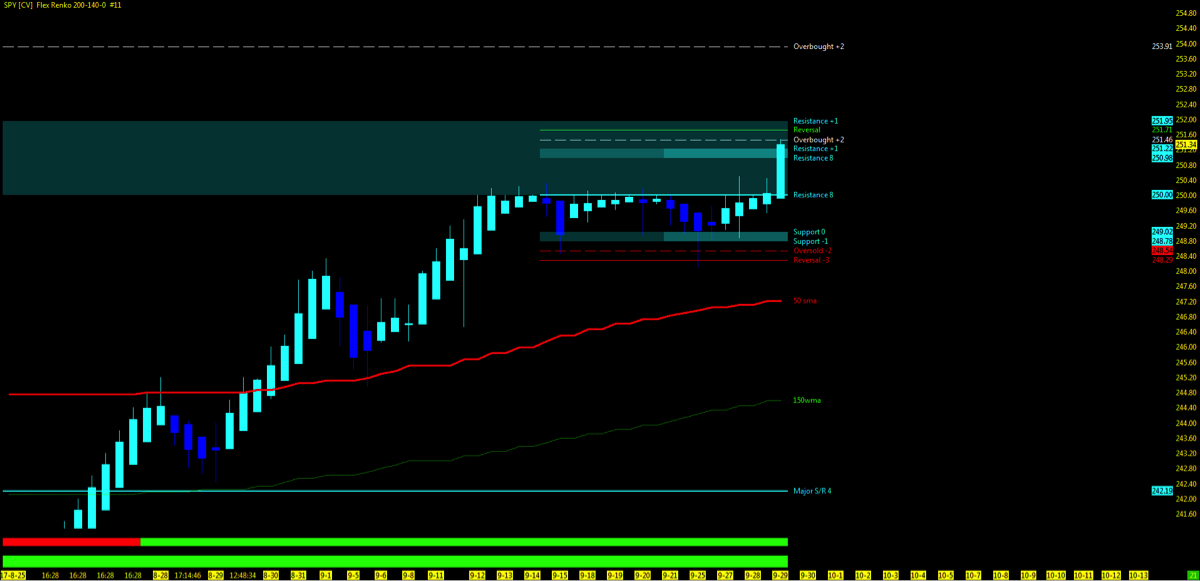
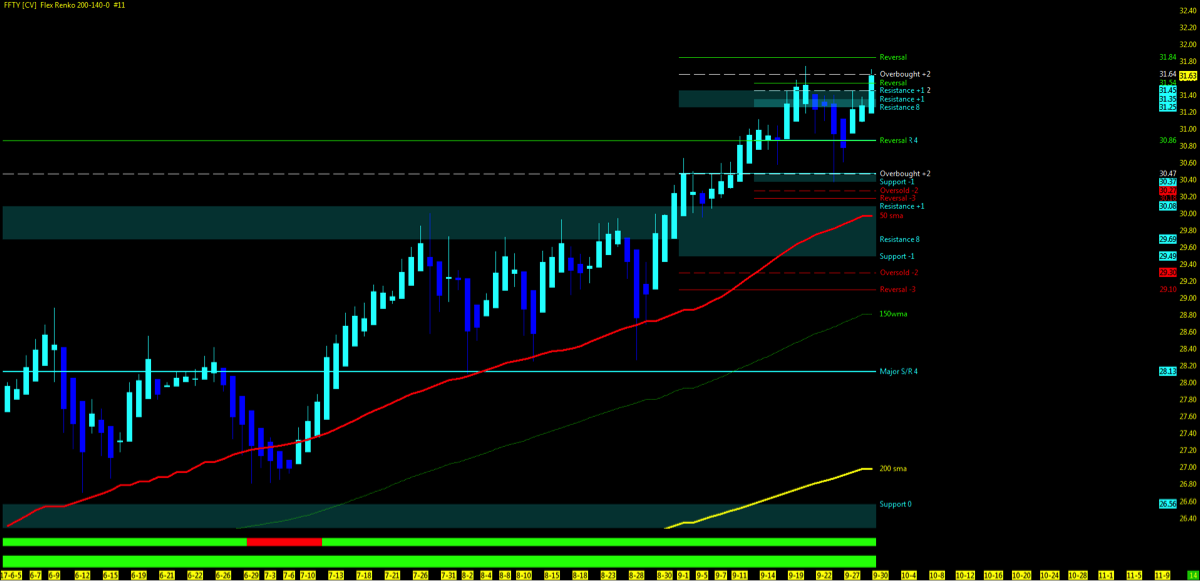
- VTI/FFTY momentum remains upside at short term MML highs
- Current IBD Outlook: Confirmed Uptrend as seen below
Key Events in the Market This Week
- USA: Yellen, ISM MFG, ADP, NFP
- GLOBAL: FR CPI
- Q4 Earnings Season
- Tesla earrings
- Car Maker Sales Report
- Google Event Monday
- Transports report September monthly
THE BOTTOM LINE
Technical Momentum probability on the indices remains in an UPTREND though with caution at long term MML highs.
October permabears hoping for a pullback as Earnings Season begins to roll out. Watch for the FAAMG stocks pullback to play out the Nasdaq futures and Tech ETF momentum. Dollar index at a key decision point.
As always, watch for MML setups on price action break above resistance high and back under resistance low. Downside, watch for ES/YM open gaps to be closed and 50% pullback as 1st level of support.
Market Indexes – Lowest Open Gaps
- S&P 500 Futures (ES): 1589
- Nasdaq Futures (NQ): 3864.75
- Russell 2000 (RTY): 1462.10
- Dow Jones Futures (YM): 14745
Attempting to determine which way a market will go on any given day is merely a guess in which some will get it right and some will get it wrong. Being prepared in either direction intraday for the strongest probable trend is by plotting your longer term charts and utilizing an indicator of choice on the lower time frame to identify the setup and remaining in the trade that much longer. Any chart posted here is merely a snapshot of current technical momentum and not indicative of where price may lead forward.
Thanks for reading and remember to always use a stop at/around key technical trend levels.
Twitter: @TradingFibz
The author trades futures intraday and may have a position in the mentioned securities at the time of publication. Any opinions expressed herein are solely those of the author, and do not in any way represent the views or opinions of any other person or entity.

: Worrisome to Broader Market?")


