The market has been very strong to start 2018 but there are a few near-term concerns bubbling up. Investor sentiment has become overheated, the broader stock market is overbought, and the Russell 2000 and small cap stocks are still lagging.
Key Takeaways: Small-caps are trending higher and making new highs, but they have been struggling to keep pace with large-caps. Small-cap relative weakness shows up at the industry group-level as well. Seasonal patterns become more of a challenge for small-caps as we move through 2018, while sentiment is already a headwind.
Even as Broad Market Rallies, Small-Caps Have Struggled to Keep Pace
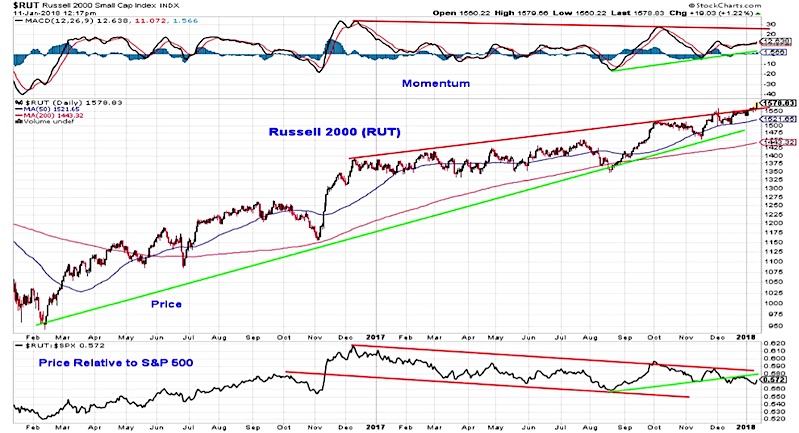
The Russell 2000 small-cap index is in a longer-term up-trend and has joined its large-cap counterparts in making new highs in early 2018. While the S&P 500 has seen momentum surge to the upside, the momentum backdrop for the Russell 2000 is more ambiguous. On a relative price basis (today’s move notwithstanding), the Russell 2000 has struggled to keep pace with the S&P 500. Since the October relative peak in the Russell 2000 (which itself was a lower high), the Russell 2000 has made a series of lower highs and lower lows versus the S&P 500.
The breadth internals for small-caps are also weaker than their large-cap counterparts. The new high list for the S&P 500 has been expanding since mid-December, while the new high list for the small-cap S&P 600 has hardly moved (and has been trending lower since October). Coming into today, the median stock on the S&P 500 is just 4% shy of its 52-week high, while the median stock on small-cap S&P 600 is nearly 12% from its 52-week high. Some 30% of the small-cap stocks are more than 20% off their 52-week highs. It will take more than one day of strength to reverse these trends.
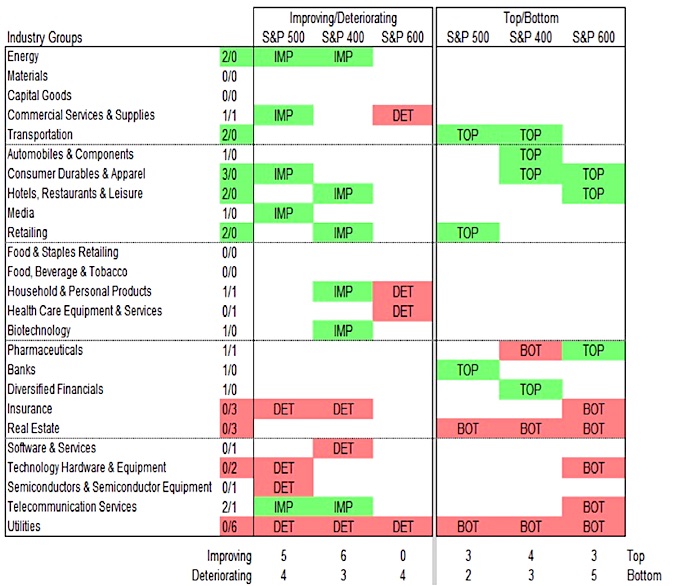
Large-cap and mid-cap industry groups are clustered near the top of our industry group relative strength rankings, while small-cap groups dominate the bottom of the rankings (taking up five of the bottom 10 positions). Moreover, more large-cap and mid-cap groups are seeing improving relative strength conditions than deteriorating conditions. Small-cap groups are seeing further relative strength deterioration. In other words, based on this relative strength work, small-caps are relatively weak and getting weaker, while large-caps and mid-caps have been relatively strong and are getting stronger.
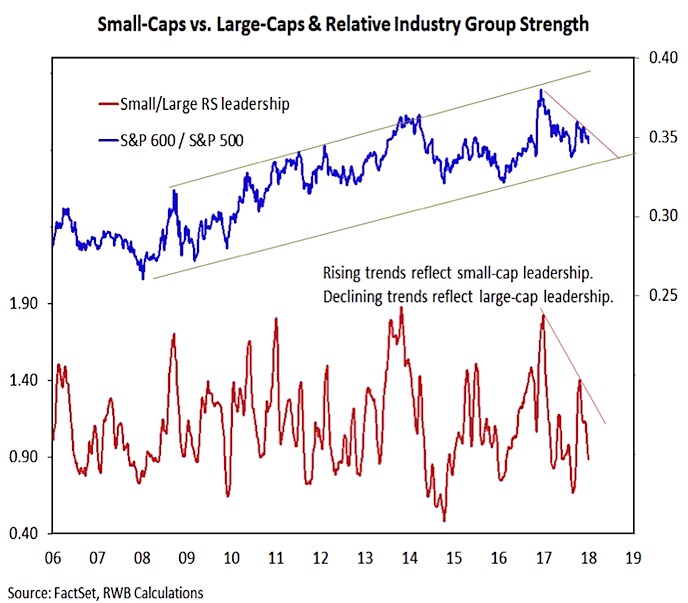
Another way to view these relative leadership trends are on an aggregate basis. The top half of this chart shows the ratio between the small-cap S&P 600 and the large-cap S&P 500. The bottom half is the ratio between the relative strength ranking of the average small-cap industry group and the average large-cap industry group. In both instances, these lines peaked in early 2017 and have moved lower since, denoting large-cap leadership. As was seen on the chart of the Russell 2000, small-cap relative strength has deteriorated significantly since October.
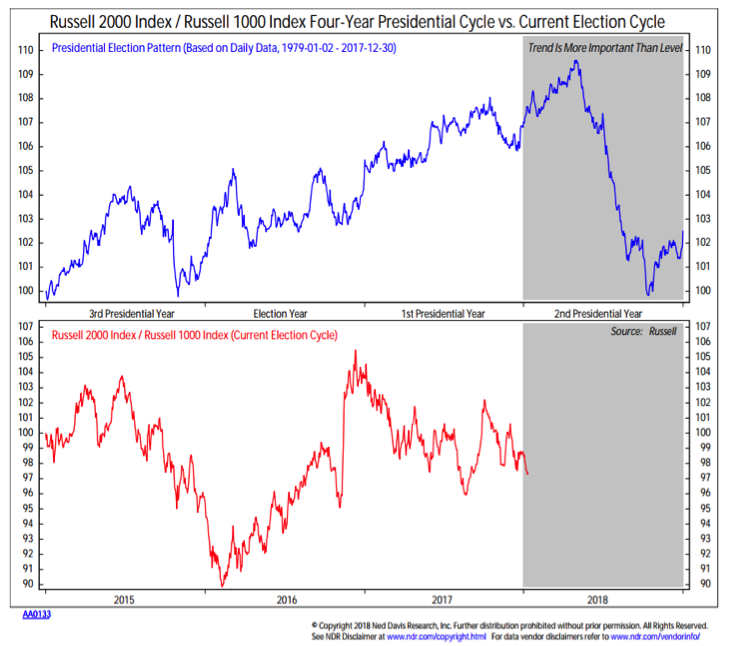
While the current price and breadth trends are favoring large-caps, seasonal patterns suggest there is a window of opportunity for small-cap leadership in the first quarter of 2018 and again in the wake of the November mid-term elections. The problem is that the most pronounced and protracted period of small-cap relative weakness in the entire Four-Year Presidential Cycle comes in the middle two quarters of mid-term election years.
Working against small-caps in the near term is evidence of excessive optimism. Large-caps tend to hold up better after sentiment turns overly optimistic while small-caps tend to see relative strength in the wake of excessive pessimism. Bullish sentiment right now is widespread. Short interest on both the NYSE and NASDAQ saw big drops in December, and the NDR Crowd Sentiment poll (which is an aggregation of a number of individual sentiment surveys) moved to its highest level on record this week.
Thanks for reading.
Twitter: @WillieDelwiche
Any opinions expressed herein are solely those of the author, and do not in any way represent the views or opinions of any other person or entity.


