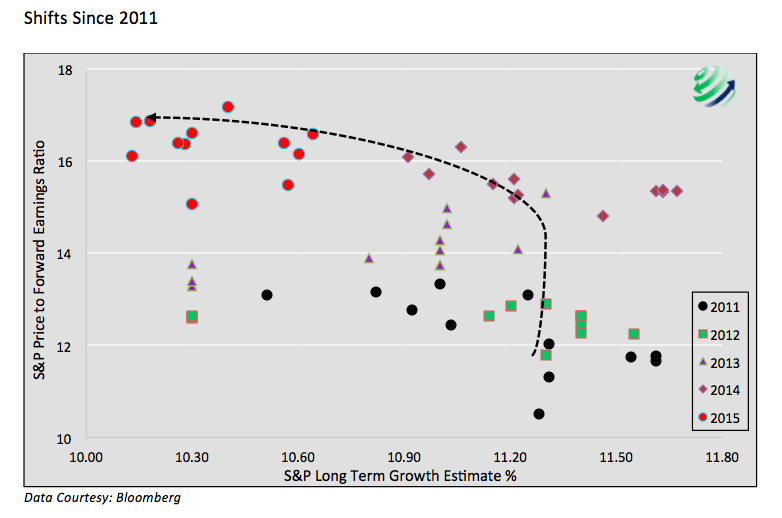
To help answer the question on which way the yellow dot might shift, we focus on long term earnings growth and the price to forward earnings ratio which are the x and y-axis respectively of the preceding charts.
Long term earnings trends tend to be highly correlated with economic activity. In the year 2000 investors were incredibly optimistic as expected long term earnings growth rates peaked over 18%. Since then, the expected growth rate of earnings has fallen to 10% and currently resides less than 1% above the pessimistic outlooks observed during the great financial crisis of 2008. The trend this millennium should not come as a surprise as GDP growth, the ultimate driver of long term earnings, has been decelerating for years. The graph to the left uses a 3-year moving average trend line to smooth GDP data. Despite ebbs and flows, the rate of economic growth has been steadily declining for well over 60 years.
Given our stated views on productivity growth declines and the massive level of indebtedness, it is not unreasonable to forecast that actual long term earnings growth will likely follow the GDP trend lower in the future. That does not mean the market cannot temporarily witness periods of optimism where the expected growth rate increases. We are comfortable predicting that long term earnings growth will most likely shift left along the x axis, at least until there is a profound change to the way the government and Federal Reserve promote economic growth. 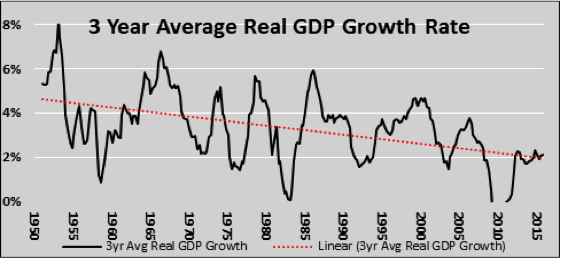
Earnings are a function of revenue and corporate profit margins. Our earnings growth forecast in the prior paragraph holds true for revenue growth. As long as GDP continues to trend lower, revenues will likely be challenged as well. Margins, on the other hand, are not as reliant on economic growth. Over the last few years, for instance, margins exploded to record levels despite below trend GDP growth. Layoffs, deficient investment, stock buybacks, mergers and a host of other factors, including suspect measurement, facilitated greater profits per dollar of revenue for shareholders.
Margins have a long history of expanding and contracting within a well-defined range. Currently, margins are at the top end of that range, making further margin expansion difficult to expect. In fact many of the aforementioned methods in which companies increased margins have been largely depleted, which adds to our expectation that margins will contract to more normal levels over the coming years. Given the declining long term trend in economic growth and therefore revenues, coupled with expectations for lower margins, we are left to assume forward earnings estimates will also decline.
And will likely put additional pressure on equity valuations going forward, as well as futures returns.
Declining long term earnings growth forecasts and forward earnings estimates coupled with historically high equity valuations is a recipe for poor returns. This concoction would most likely result in a shift somewhere between arrows C and D in the chart entitled “Potential Data Shifts” above.
20% Downside and Then Some
A quick glance at the scatter plot would lead one to assume that a 20% decline in the S&P 500 with no change in forward earnings estimates or long term growth forecasts would result in a fairer view of equity valuations (the yellow dot would follow the path of the C arrow shown above). That is correct, but we would be remiss if we did not mention two other important factors. First, corrections frequently move beyond trend lines and tend to “overcorrect”. Based on the data shown above, it is not farfetched to assume the yellow data point could fall an additional 10-20% below the trend line. Secondly, as stock prices decline, the economy may likely suffer as well. Therefore we should also consider the ramification of a decline in forward earnings estimates and possibly long term growth forecasts. The one takeaway we hope you arrive at is that a decline akin to those seen in 2000 and 2008 is not out of the realm of possibilities.
Many other equity valuation measures also predict poor future returns. We urge investors to carefully consider the implications of holding a large equity allocation at this time. We believe that our tag line is worth careful consideration here: “At 720 Global, risk is not a number. Risk is simply overpaying for an asset.”
Thanks for reading.
Any opinions expressed herein are solely those of the author, and do not in any way represent the views or opinions of any other person or entity.


