Key Takeaway: Our preferred measures of valuation, which rely on trailing reported earnings, continue to suggest stocks are expensive. Stock market valuations (i.e. measures) based on forward earnings are dependent upon dubious earnings forecasts.
In the words of John Maynard Keynes, the stock market can stay irrational longer than you can stay solvent. As such, stock market valuations are not particularly good market timing or tactical indicators.
However, there is useful information embedded within valuations as it pertains to risk in the stock market. Since at the end of the day we are risk managers, valuations are an important tool in the tool box.
There are multiple ways that investors can measure stock market valuations. For the purpose of this discussion, we will limit it to three basic approaches:
- Price compared to actual earnings
- Price compared to forecast/forward earnings
- Price/earnings ratios for stocks compared to some interest rate metric
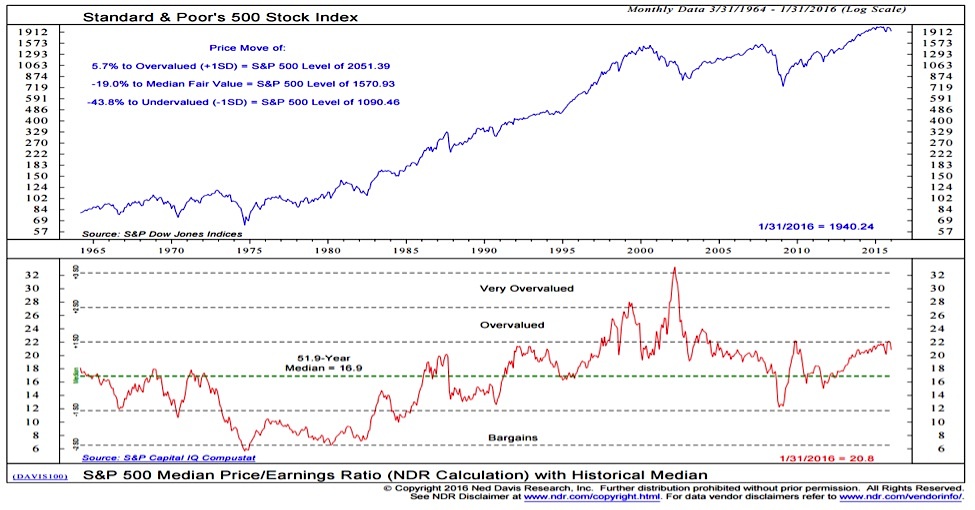
We have a strong preference for looking at prices compared to actual earnings. In fact, our primary valuation indicator looks at the median price/earnings (P/E) ratio for companies within the S&P 500, using for the ‘E’ actual reported earnings. By using the median P/E, we limit distortions that might be caused by one or two companies (or even an entire sector) being out of whack. On this basis, stocks are about as expensive as they have ever been outside of the stock market bubble that emerged in the late-1990’s.
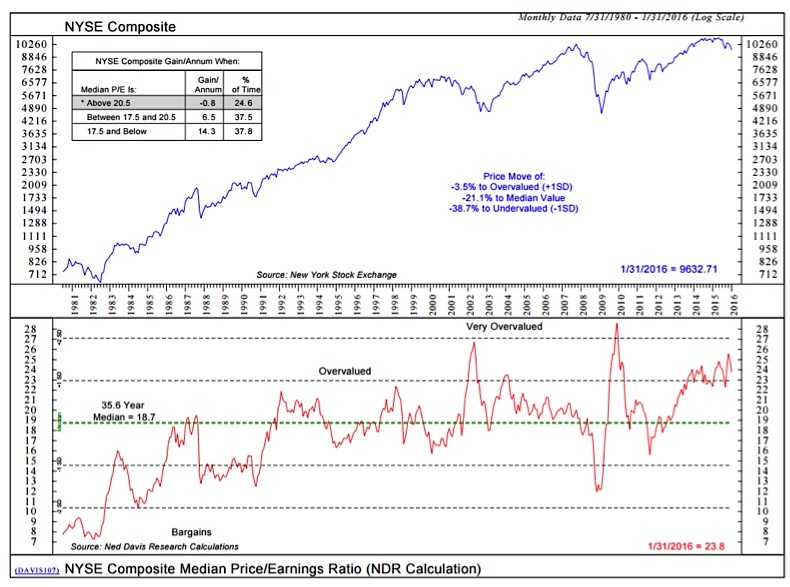
Applying this same approach to the NYSE Composite, stocks are more expensive than at the 2000 and 2007 stock market peaks.
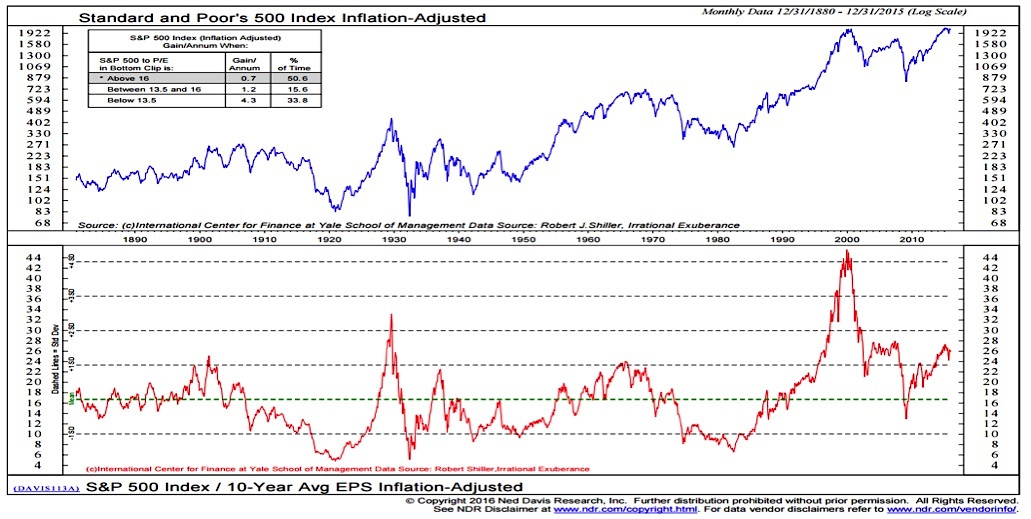
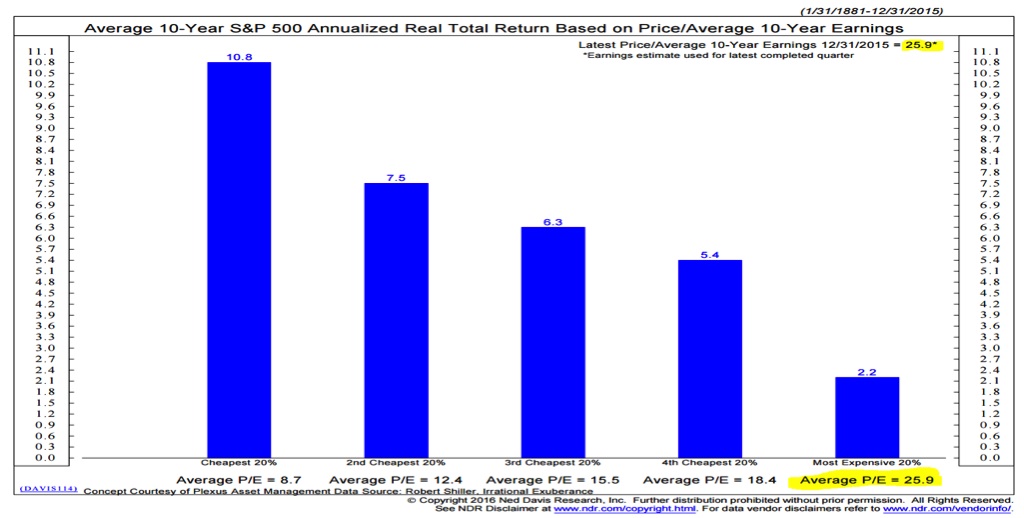
While stock market valuations are poor tactical indicators, there is a strong inverse relationship between P/E ratios and forward stock market returns that emerges over time. Using the valuation approach advanced by Nobel Laureate Robert Shiller (which compares current prices to cyclically adjusted earnings), we can see that returns for the stock market have been greatest following periods when stocks are cheap and returns have been more muted following periods when stocks were expensive (as is currently the case). The following charts show the P/E ratio based on Shiller’s earnings data as well as the breakdown of forward stock market returns by P/E quintile.
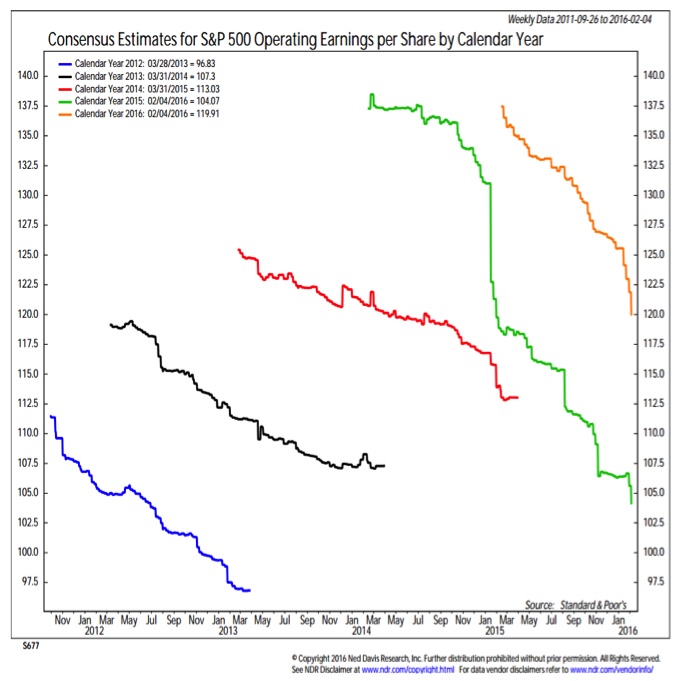
The stock market is a discounting mechanism, and so there is some logic to looking at expected earnings when developing P/E ratios and discussing valuations. The problem is that earnings forecasts (like forecasts of almost any type) are notoriously inaccurate. This has been especially true the past few years. Earnings forecasts start off elevated (making stocks look relatively cheap based on forward P/E ratios) and move lower over the course of the year. Earnings were originally expected to show robust growth in 2015, but the final number for 2015 is below what was actually seen in 2014 and 2013. The estimates for 2016 are holding true to the recent pattern.
Finally, while there is some merit in comparing valuation measures for stocks to valuation measures for bonds, there are too many cross-currents to make this a simple apples-to-apples comparison. For one, the logic of relative valuation measures break down at extremes. Zero percent interest rates would imply infinite P/E ratios for stocks. That defies logic and experience.
Thanks for reading.
Twitter: @WillieDelwiche
Any opinions expressed herein are solely those of the author, and do not in any way represent the views or opinions of any other person or entity.


