The popular stock market averages remained locked in a tight trading range last week but under the surface broad market trends continue to deteriorate. Evidence of this is seen in the relatively poor performance of many broad-based stock market indices including the Russell 2000 (INDEXRUSSELL:RUT) which fell twice as hard as the S&P 500 Index (INDEXSP:.INX) over the past two weeks.
Stocks are being negatively impacted by ongoing uncertainty surrounding the November election, mixed third-quarter earnings results and rising inflation concerns. The stock market historically rallies after the election which also fits with the assumption of a year-end rally based on favorable stock market seasonality trends. But the election is still week away…
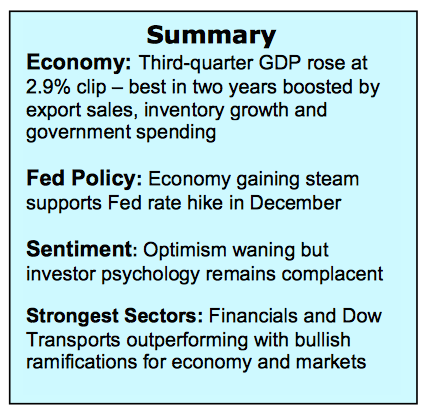
Third-quarter earnings have been mixed and have not provided the bullish catalyst many anticipated. But the stronger-than-expected third-quarter GDP print provides encouragement that profits will improve moving into 2017 as economic growth typically precedes earnings growth. The Fed meets this week which will lead to further anticipation of a December rate hike. This offers the potential that a December increase in the fed funds level will be fully discounted by the time the Fed meets in mid-December.
This week’s economic data includes the October employment numbers. Consensus estimates are the economy generated nearly 200,000 new jobs with the unemployment rate falling to 4.9%.
The technical condition of the stock market suffered some deterioration last week. Our largest concern is that market breadth continues to weaken and most of the stock market averages are trading below their 50-day moving averages. Until recently, the decline in market breadth has been confined to short-term statistics but any further deterioration could eventually trigger erosion in long-term market breadth that was a strong support for stocks in 2016.
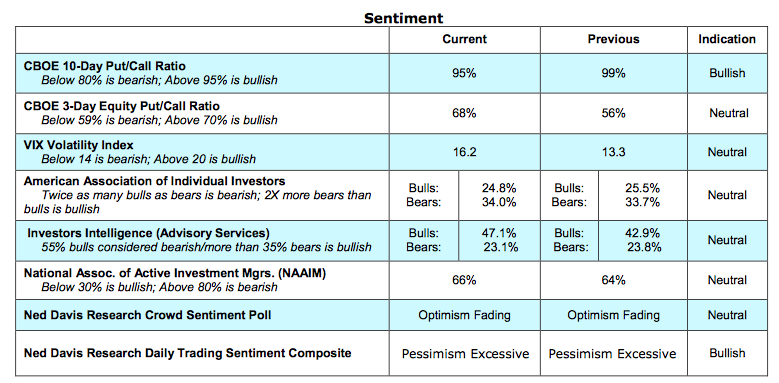
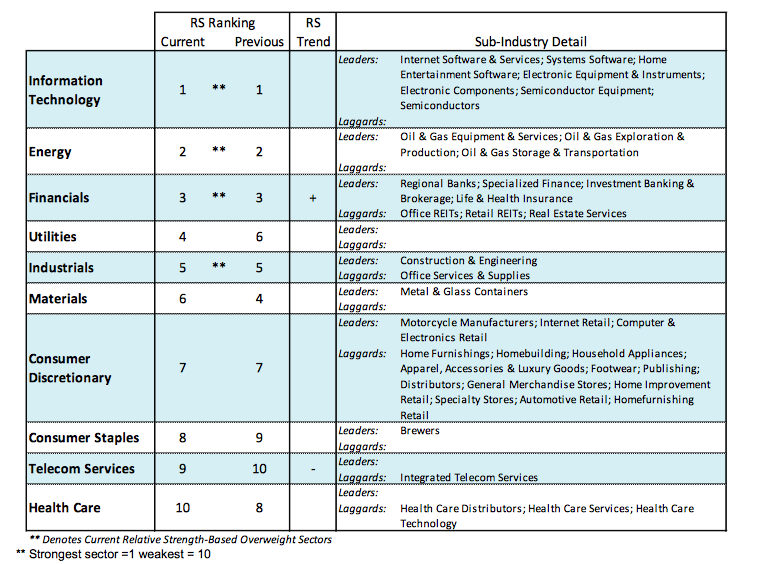
Indicators of investor psychology continue to suggest widespread complacency. This points to a continuation of the July – October trading range but the S&P 500 (2126) is precariously close to support which is near 2120. A break of that level holds the potential to shift the mood of investors into the fearful camp. Using contrary opinion, this would be a positive sentiment development and would be measured by a jump in the CBOE Volatility Index VIX-16) to above 20 accompanied by a sharp drop in the asset allocation toward stocks in the report from the National Association of Active Investment Managers (NAAIM). The strongest sectors of the market are information technology, financials and industrials. These areas should be considered for new money should the market become oversold.
Thanks for reading.
Twitter: @WillieDelwiche
Any opinions expressed herein are solely those of the author, and do not in any way represent the views or opinions of any other person or entity.


: Showing Some Signs of Emerging Strength")
