The equity markets broke out to the upside last week with popular stock market averages hitting new 52-week highs.
The advance in the final month of the second quarter is growing more inclusive with the NYSE Composite and the Wilshire 5000 joining the S&P 500 (INDEXSP:.INX), NASDAQ Composite (INDEXNASDAQ:.IXIC) and the Dow Utilities hitting new record highs.
There remains a concern that the stock market is getting ahead of the economic fundamentals. The current situation, however, is very different than 2015, the last time the stock market experienced a significant correction. Two years ago, the economy was languishing in 1.5% GDP growth, the global economy was flirting with recession and the broad market was in a severe downward spiral.
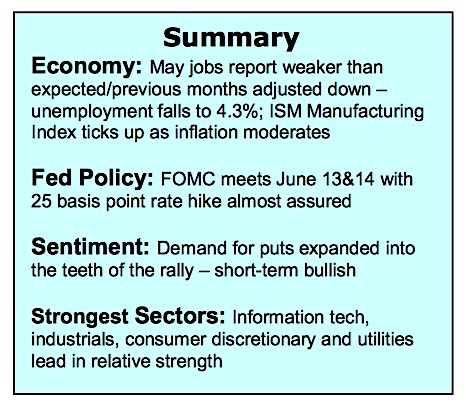
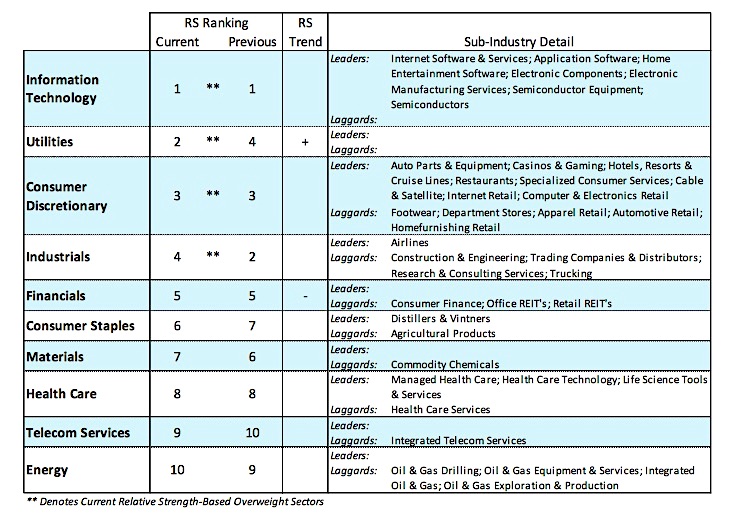
In the present example, second-quarter U.S. GDP growth estimates are above 3.00%, the global economy is in a well-defined recovery and despite three months of churning, 70% of the S&P 500 industry groups are in uptrends. A peak in the stock market is not likely unless interest rates climb significantly and/or investor confidence becomes excessive. We continue to recommend large-cap growth stocks concentrating in the strongest sectors that include technology, industrials and consumer discretionary.
The technical picture for stocks improved significantly the past two weeks suggesting higher prices should be anticipated into the summer months. The bullish short- and intermediate-term trends are now being supported by improvement in overall market breadth. Evidence of this is seen in the record high by the NYSE advance/decline line and by the NYSE Composite Index reaching a new record high.
The NYSE Composite contains more than 2200 issues. Only a handful of stocks accounted for most of the gains in the S&P 500 Index for a large portion of the year. In recent weeks support has expanded where 20% of the S&P 500 issues are now up 20% or more for the year. Additionally, 435 issues hit new highs last week compared to 379 the previous week. The fact that the broad market is moving back in gear with the S&P 500 is a bullish signal. The broad market typically peaks three to six months prior to a peak in the popular averages.
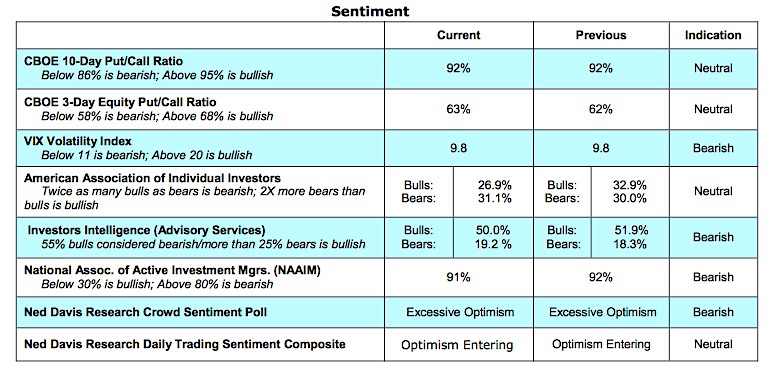
From a sentiment perspective, the breakout to new highs has surprisingly not attracted a lot of optimism. Indicators of investor psychology show optimism, but mixed with a healthy measure of anxiety. The data from the Chicago Board of Options Exchange (CBOE) is particularly telling as the numbers show a significant improvement in the demand for put options just prior to and following the breakout into new high territory by the S&P 500 and NASDAQ Composite (put buyers anticipate a stock market decline). The most recent survey from the American Association of Individual Investors (AAII) shows more bulls than bears, which is very unusual with the stock market sitting on top of record highs.
Thanks for reading.
Twitter: @WillieDelwiche
Any opinions expressed herein are solely those of the author, and do not in any way represent the views or opinions of any other person or entity.

 Flirting With Critical Support… Again")
