Since the market’s dramatic intraday reversal at the lows of the year on Oct. 13, the equity indexes have rallied in the face of headwinds from rising interest rates, lowered earnings expectations, big high-profile earnings misses, and the uncertainty of tomorrow’s Fed announcement.
This may be a bear market rally, but it has interesting leadership in two ways.
First, the Dow has had the biggest percentage gain off the October low relative to the SPY, QQQ, and IWM, but that can be attributed to just a handful of stocks.
Secondly, and more noteworthy for the durability of the rally, is what’s happening between the SPY, QQQ and IWM.
The chart below provides a good explanation for why stock indexes have rallied during earnings season.
As you can see by the green line that represents the average trajectory of consensus Q3 earnings estimates since 2014, they tend to decline this time of year.
This year’s trajectory has been significantly lower than normal.
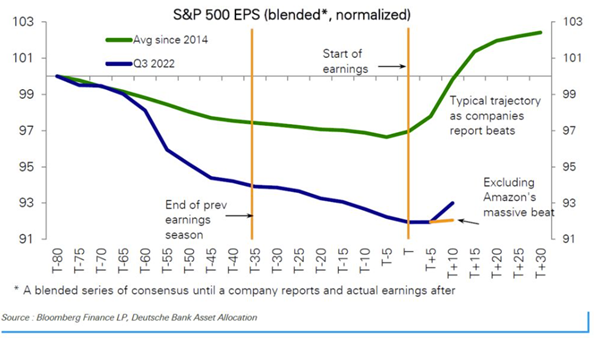
Additionally, they have come down for every sector except for three: Energy, Transportation, and Auto.
Some of the worst declines have been -21.2% for construction, a -16.4% decrease for technology, a -15.3% loss for retail, a -14.6% decrease for consumer discretionary, and a -10.7% fall for industrials.
With 52% of the S&P 500 having reported, 71% have reported better than expected results. This is below the 5-year average of 77%, but with such low expectations to beat, markets have been able to rally.
The rally, however, has not been equal between the SPY, QQQ and IWM. The Russel 2000, IWM, has been the leader by several measures.
On a percentage basis since Oct. 12th, IWM is up over 9% while the SPY and QQQ are up about 7% and 4% respectively.
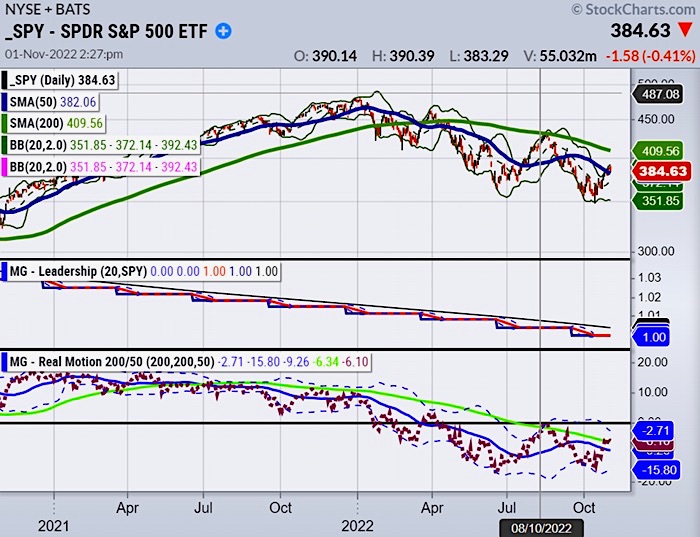
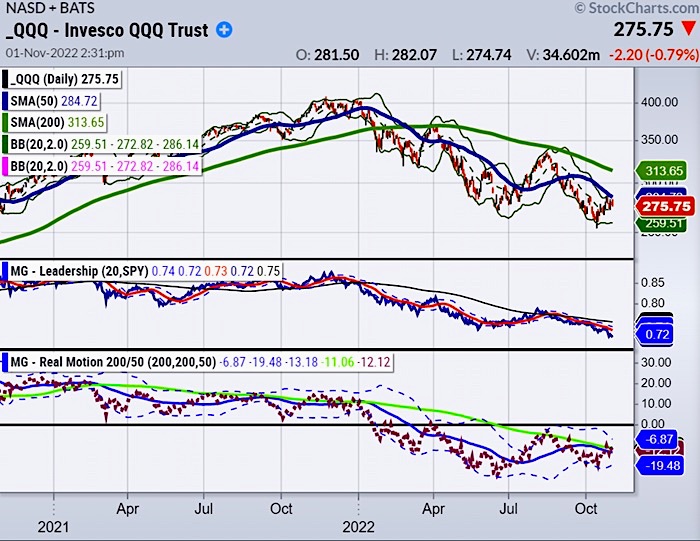
On a relative basis, IWM is well above its 50 DMA and closing in on its 200 DMA, while the SPY is sitting at its 50 DMA and QQQ has yet to touch its 50-DMA.
As you can see in the charts below, all indexes are near either their 50 or 200 DMA’s as we head into the Fed’s announcement tomorrow.
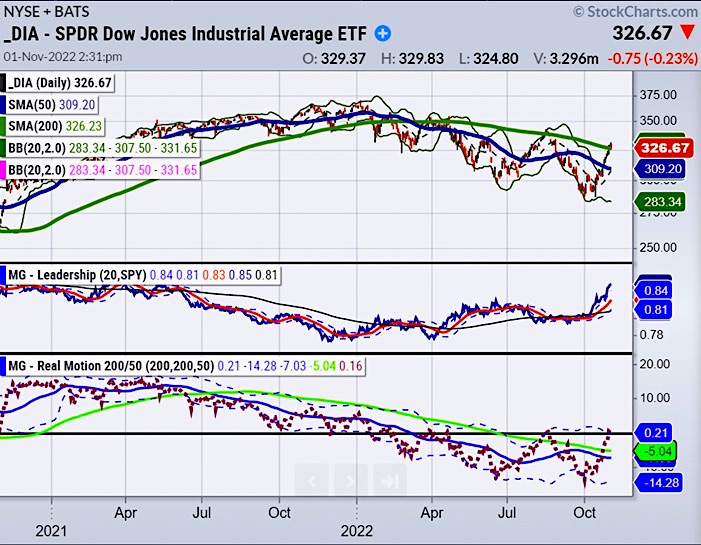
The last bear market rally ended in August with the 200 DMA acting as the ceiling. The DIA and IWM are back or about to challenge these key resistance levels again.
The leadership performance of the IWM suggests that it is the one to watch for insight into whether the equity indexes will continue higher or roll over at their respective resistance levels.
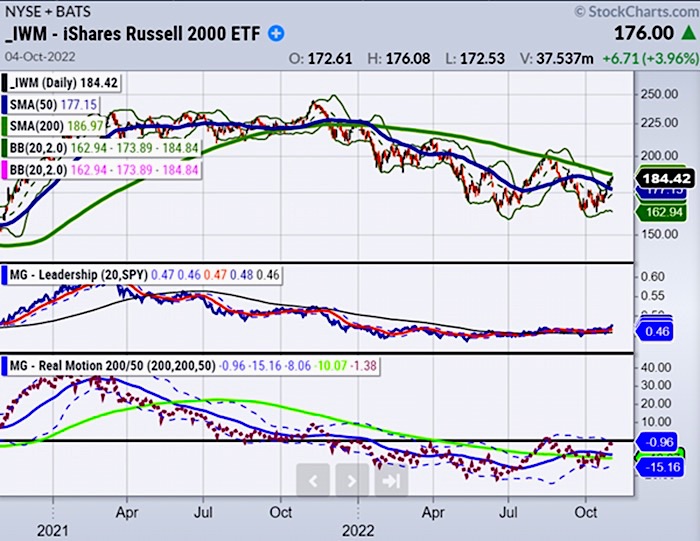
IWM is about to reclaim and cross its 200-day moving average and the Real
Motion Indicator is crossing the zero-line displaying strong upward momentum.
IWM looks to be on the verge of a strong break out.
To learn more about Mish’s trading service or how our Real Motion Trading Indicator and our TriplePlay Trading Indicator integrate on trading platforms such as StockCharts, Fidelity, and TradeStation, you can sign up for a consultation with Rob Quinn, our Chief Strategy Consultant, here.
Mish in the Media:
BNN Bloomberg 10-27-22The New Paradigm – Small Caps Over Tech Stocks
Stock Market ETFs Trading Analysis & Summary:
S&P 500 (SPY) Sold off into previous support (386) with 380 still support and 390 first resistance level to watch.
Russell 2000 (IWM) 181 still support and 186 same resistance
Dow (DIA) 324 support and 328 resistance
Nasdaq (QQQ) Sold off into previous support twice (277) and (275) with 273 now support and 277 resistance
KRE (Regional Banks) 62 support and 65 resistance level; same as before
SMH (Semiconductors) 186 support and 193 resistance
IYT (Transportation) 211 support and 215 resistance
IBB (Biotechnology) 127 support and 132 first resistance; same as before
XRT (Retail) 61 support and 65 resistance; same as before
Twitter: @marketminute
The author may have a position in mentioned securities at the time of publication. Any opinions expressed herein are solely those of the author and do not represent the views or opinions of any other person or entity.

: Worrisome to Broader Market?")
